And the Listings Kept on Coming!
Download May Sales and Listings Statistics All Regional
Download May Sales and Listings Statistics Houses Townhouses Condos
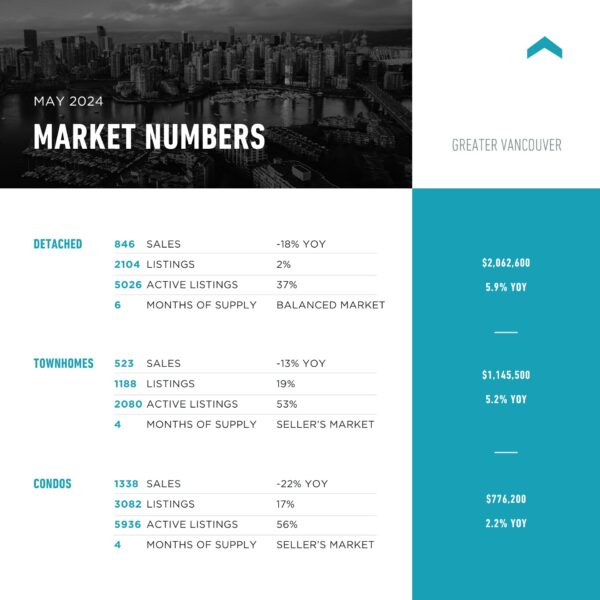
Highlights of the May 2024 report
The first Bank of Canada rate cut since 2020 – now what?
Active listings in Greater Vancouver are up 46% from last year
Buyers are being patient; sales dipped in May
Watch the Micro Markets closely
Prices are relatively flat and some are down in the last 6 months
The Canadian Economy has been speaking, and the Bank of Canada finally listened. This morning, they dropped their overnight right by a quarter point which will see rates for variable rate mortgages and lines of credit come down. While not substantial, it signals the start of downward movement with interest rates. A welcome relief to many and perhaps a signal that it’s time to buy. With the next announcement in July, many will be singing like Tim McGraw “I like it, I love it, I want some more of it.”
For the second month in a row, the story was listings. More and more listings came on the market in May, albeit off the pace of April. The result is active listing inventory is at levels not seen since later 2020 after the world opened post Covid shutdown. Buyers are more patient though, with sales overall in Greater Vancouver down from April and May of last year – although the Fraser Valley saw sales creep up from April. This only adds to the level of pent-up demand that will start to act with more favourable interest rate and economic conditions. It’s not a matter of will buyers engage, but a question of when.
While there was a break this month in new housing regulations, the market is still factoring in the numerous changes to various housing legislation introduced at the provincial and federal levels. Likely we are seeing properties listed due to capital gains changes, short term rental restrictions and investor frustration with the regulations of their rental properties they own. Owning a property in British Columbia has become a lot more difficult and more costly and as a result some sellers would rather sell than hold. This has the knock-on effect of removing some rental stock at the same time – not ideal for those struggling to find a rental.
There were 2,733 properties sold in Greater Vancouver in May after seeing 2,831 properties sold in April and 2,415 properties sold in March this year. This was a 20% decrease from the 3,411 properties sold last year in May. This marked the first month-over-month decline in sales this year. With increased listing counts, it should have brought on more sales, but buyers are continuing to show more patience and take advantage of the opportunity of choice.
Sales in May were 20% below the 10-year average after being 12% below the 10-year-average in April and 30% below the 10-year average in March. One step forward, one step backward seems to be the theme in the real estate market. But with the number of homes for sale increasing, this will lead to a better chance for increasing home sale when buyers engage. And that may just be this month. What seems to be happening though is that real estate activity is occurring in many different micro markets. Detached houses on Vancouver’s West Side can sell with 5 offers in the $3M range while apartment listings below $1 Million can sit.
Detached properties overall saw the lowest growth in new listings in May, while townhouses surprisingly showed the most growth in new listings. And apartment sales were down the most year-over-year, likely an indication of how much higher interest rates are impacting that end of the market. First time buyers while getting the benefit of more choice still must contend with higher rates and especially the stress test which adds another 2% onto the rate for qualification purposes. Expect to see that segment of the market move quickly with rate reductions. Looking at detached home sales, they were up 4% month-over-month while down 18% year-over-year (although Pitt Meadows and Maple Ridge saw more sales year-over-year), townhouse sales were down 20% month-over-month and down 13% year-over-year and condo sales were down 6% month-over-month and down 22% year-over-year.
As listings increased in the last two months, the months of supply didn’t increase much if at all in some areas. Greater Vancouver ticked up to 5 months supply (on the border of balanced to seller’s market), while some areas like North Vancouver (even with the number of active townhouse listings double the amount there were in May 2023), Port Coquitlam and Pitt Meadows are at 3 months supply, while New Westminster, Coquitlam, Port Moody and Ladner are at 4 months supply. All while listings totals ramped up.
While we didn’t hit 7,000 for the number of new listings in May, after reaching 7,229 in April in Greater Vancouver, there were still 6,484 new listings that came on. Just shy of the May 2022 at 6491 and off the May 2021 high for that month at 7,276. For a variety of reasons sellers were coming to the market over the last 2 months, after being patient over the last 2 years. As we’ve said, significant pent-up supply had been building as many moves were on hold due to higher interest rates, lack of buyer demand and an inability to find the next home. With more choice available for sellers, we are seeing the sell and buy transactions coming back into the market. That has been missing over the last few years. And with more supply, prices are holding and, in some areas, and property types seeing downward pressure.
The number of new listings in May were 7% above the 10-year average after April was 29% above the 10-year average and March was 9% below the 10-year average. May will typically see a significant number of sellers come to the market in advance of summer, so it isn’t surprising to see those numbers. We’ll see the number of new listings decrease as June winds down and the summer months come upon us.
There were 13,600 active listings in Greater Vancouver at month end, compared to the 12,491 actives at the end of April and 10,552 at the end of March. With sales to listings ratios around 40% over the last two months, it’s allowed active listing counts to grow quickly in the region. Compared to this time last year, listings are up 46% from the 9,293 at the end of May 2023. Detached active listings are up 37% year-over-year, while townhouses are up 53% and condos are up 56%. The detached market overall in Greater Vancouver remains at 6 months supply – a balanced market. Vancouver’s East Side is bucking this trend though, sitting with 4 month’s supply for all residential properties and producing some interesting multiple offer sales. Townhomes moved up to 4 months supply from 3 and condos stayed at 4 months supply – keeping both technically in seller’s market conditions in Greater Vancouver. Area by area market activity and the level of competition for listings will vary. Considering how much has come on the market; we still aren’t close to a true buyer’s market and it wont’ take much to see the shift back to a seller’s market.
The last two months have seen a shift in the real estate market to more active sellers and increased buyer hesitation. With so much talk about interest rates, it’s easy to see why buyers are playing the waiting game. With visions of lower rates, why buy now and let’s shop for the best deal has become theme in the buyer world. But tides can shift quickly, when interest rates creep down. Buyers may soon find that the competition they were trying to avoid may come back quicker than expected. Those not distracted or hampered by elevated interest rates could see the best buying opportunity in some time.
Here’s a summary of the numbers:
Greater Vancouver: Total Units Sold in May were 2,733 – down from 2,831 (3%) in April, up from 2,415 (13%) in March, down from 3,411 (20%) in May 2023, down from 2,947 (7%) in May 2022, down from 4,346 (37%) in May 2021, up from 1,506 (81%) in May 2020, and up from 2,669 (2%) in May 2019; Active Listings were at 13,600 at month end compared to 9,293 at that time last year (up 46%) and 12,491 at the end of April (up 9%); New Listings in May were down 10% compared to April 2024, up 12% compared to May 2023, down 0.1% compared to May 2022, down 11% compared to May 2021, up 72% compared to May 2020, and up 8% compared to May 2019. Month’s supply of total residential listings is up to 5 month’s supply from 4 (balanced market conditions) and sales to listings ratio of 42% compared to 39% in April 2024, 59% in May 2023, and 45% in May 2022.
Month-over-month, the house price index is up 0.5% and in the last 6 months up 2.5%.
Vancouver Westside: Total Units Sold in May were 501 – up from 471 (6%) in April, up from 424 (18%) in March, down from 624 (20%) in May 2023, down from 582 (14%) in May 2022, down from 736 (32%) in May 2021, up from 264 (90%) in May 2020, and up from 460 (9%) in May 2019; Active Listings were at 2,962 at month end compared to 2,115 at that time last year (up 40%) and 2,778 at the end of April (up 7%); New Listings in May were down 11% compared to April 2024, up 12% compared to May 2023, up 4% compared to May 2022, down 11% compared to May 2021, up 79% compared to May 2020, and up 26% compared to May 2019. Month’s supply of total residential listings is steady at 6 month’s supply (balanced market conditions) and sales to listings ratio of 38% compared to 31% in April 2024, 53% in May 2023, and 46% in May 2022.
Month-over-month, the house price index is down 0.2% and in the last 6 months up 2.0%.
Vancouver East Side: Total Units Sold in May were 329 – down from 349 (5%) in April, up from 285 (15%) in March, down from 360 (9%) in May 2023, up from 318 (3%) in May 2022, down from 474 (31%) in May 2021, up from 167 (97%) in May 2020, and up from 328 (0.3%) in May 2019; Active Listings were at 1,459 at month end compared to 1,006 at that time last year (up 45%) and 1,369 at the end of April (up 7%); New Listings in May were down 16% compared to April 2024, up 12% compared to May 2023, down 4% compared to May 2022, down 15% compared to May 2021, up 88% compared to May 2020, and up 19% compared to May 2019. Month’s supply of total residential listings is steady at 4 month’s supply (seller’s market conditions) and sales to listings ratio of 45% compared to 41% in April 2024, 56% in May 2023, and 45% in May 2022.
Month-over-month, the house price index is up 0.4% and in the last 6 months up 1.9%.
North Vancouver: Total Units Sold in May were 245 – down from 248 (1%) in April, up from 187 (31%) in March, down from 288 (15%) in May 2023, down from 280 (12%) in May 2022, down from 358 (32%) in May 2021, up from 136 (80%) in May 2020, and down from 257 (5%) in May 2019; Active Listings were at 796 at month end compared to 514 at that time last year (up 55%) and 711 at the end of April (up 12%); New Listings in May were down 12% compared to April 2024, up 21% compared to May 2023, up 11% compared to May 2022, down 11% compared to May 2021, up 59% compared to May 2020, and up 4% compared to May 2019. Month’s supply of total residential listings is steady at 3 month’s supply (seller’s market conditions) and sales to listings ratio of 46% compared to 41% in April 2024, 66% in May 2023, and 58% in May 2022.
Month-over-month, the house price index is up 1.4% and in the last 6 months up 3.8%.
West Vancouver: Total Units Sold in May were 67 – down from 70 (4%) in April, up from 53 (21%) in March, down from 80 (16%) in May 2023, down from 69 (3%) in May 2022, down from 90 (26%) in May 2021, up from 43 (56%) in May 2020, and down from 71 (6%) in May 2019; Active Listings were at 696 at month end compared to 529 at that time last year (up 32%) and 628 at the end of April (up 11%); New Listings in May were down 12% compared to April 2024, up 12% compared to May 2023, up 6% compared to May 2022, down 3% compared to May 2021, up 81% compared to May 2020, and up 11% compared to May 2019. Month’s supply of total residential listings is up to 10 month’s supply from 9 (buyer’s market conditions) and sales to listings ratio of 26% compared to 24% in April 2024, 35% in May 2023, and 28% in May 2022.
Month-over-month, the house price index is up 2.2% but in the last 6 months up 3.8%.
Richmond: Total Units Sold in May were 299 – down from 336 (11%) in April, up from 279 (7%) in March, down from 396 (24%) in May 2023, down from 341 (12%) in May 2022, down from 505 (41%) in May 2021, up from 152 (97%) in May 2020, and up from 271 (10%) in May 2019; Active Listings were at 1,440 at month end compared to 1,043 at that time last year (up 38%) and 1,339 at the end of April (up 8%); New Listings in May were down 15% compared to April 2024, up 0.5% compared to May 2023, down 20% compared to May 2022, down 22% compared to May 2021, up 58% compared to May 2020, and down 16% compared to May 2019. Month’s supply of total residential listings is up to 5 month’s supply from 4 (balanced market conditions) and sales to listings ratio of 46% compared to 4% in April 2024, 61% in May 2023, and 42% in May 2022.
Month-over-month, the house price index is up 0.3% and in the last 6 months up 2.0%.
Burnaby East: Total Units Sold in May were 31 – up from 30 (3%) in April, down from 32 (3%) in March, down from 39 (21%) in May 2023, up from 30 (3%) in May 2022, down from 53 (42%) in May 2021, up from 18 (72%) in May 2020, and up from 25 (24%) in May 2019; Active Listings were at 117 at month end compared to 90 at that time last year (up 30%) and 114 at the end of April (up 3%); New Listings in May were down 8% compared to April 2024, down 10% compared to May 2023, down 5% compared to May 2022, down 22% compared to May 2021, up 42% compared to May 2020, and up 22% compared to May 2019. Month’s supply of total residential listings is steady at 4 month’s supply (seller’s market conditions) and sales to listings ratio of 51% compared to 45% in April 2024, 57% in May 2023, and 47% in May 2022.
Month-over-month, the house price index is up 1.1% and in the last 6 months up 4.0%.
Burnaby North: Total Units Sold in May were 166 – up from 162 (2%) in April, up from 109 (52%) in March, down from 195 (13%) in May 2023, down from 175 (5%) in May 2022, down from 241 (31%) in May 2021, up from 79 (110%) in May 2020, and up from 123 (35%) in May 2019; Active Listings were at 749 at month end compared to 450 at that time last year (up 66%) and 700 at the end of April (up 7%); New Listings in May were down 16% compared to April 2024, up 27% compared to May 2023, up 18% compared to May 2022, up 1% compared to May 2021, up 148% compared to May 2020, and up 39% compared to May 2019. Month’s supply of total residential listings is up to 5 month’s supply from 4 (balanced market conditions) and sales to listings ratio of 42% compared to 35% in April 2024, 63% in May 2023, and 53% in May 2022.
Month-over-month, the house price index is flat and in the last 6 months up 1.7%.
Burnaby South: Total Units Sold in May were 127 – down from 143 (3%) in April, down from 142 (13%) in March, down from 233 (20%) in May 2023, down from 163 (7%) in May 2022, down from 231 (37%) in May 2021, up from 64 (81%) in May 2020, and down from 131 (2%) in May 2019; Active Listings were at 645 at month end compared to 404 at that time last year (up 60%) and 537 at the end of April (up 22%); New Listings in May were up 6% compared to April 2024, up 8% compared to May 2023, up 15% compared to May 2022, down 12% compared to May 2021, up 168% compared to May 2020, and up 7% compared to May 2019. Month’s supply of total residential listings is up to 5 month’s supply from 4 (balanced market conditions) and sales to listings ratio of 37% compared to 44% in April 2024, 73% in May 2023, and 54% in May 2022.
Month-over-month, the house price index is up 0.5% and in the last 6 months up 2.4%.
New Westminster: Total Units Sold in May were 115 – up from 105 (10%) in April, up from 108 (6%) in March, down from 142 (19%) in May 2023, down from 117 (2%) in May 2022, down from 194 (41%) in May 2021, up from 73 (58%) in May 2020, and down from 127 (9%) in May 2019; Active Listings were at 428 at month end compared to 258 at that time last year (up 66%) and 408 at the end of April (up 5%); New Listings in May were down 14% compared to April 2024, up 4% compared to May 2023, down 14% compared to May 2022, down 21% compared to May 2021, up 38% compared to May 2020, and down 21% compared to May 2019. Month’s supply of total residential listings is up steady at 4 month’s supply (seller’s market conditions) and sales to listings ratio of 53% compared to 42% in April 2024, 69% in May 2023, and 47% in May 2022.
Month-over-month, the house price index is up 0.4% and in the last 6 months up 3.8%.
Coquitlam: Total Units Sold in May were 228 – down from 238 (4%) in April, down from 235 (3%) in March, down from 284 (20%) in May 2023, down from 244 (7%) in May 2022, down from 350 (35%) in May 2021, up from 132 (72%) in May 2020, and up from 205 (14%) in May 2019; Active Listings were at 914 at month end compared to 555 at that time last year (up 65%) and 802 at the end of April (up 14%); New Listings in May were down 6% compared to April 2024, up 11% compared to May 2023, up 11% compared to May 2022, down 10% compared to May 2021, up 41% compared to May 2020, and down 1% compared to May 2019. Month’s supply of total residential listings is up to 4 month’s supply from 3 (seller’s market conditions) and sales to listings ratio of 44% compared to 43% in April 2024, 61% in May 2023, and 53% in May 2022.
Month-over-month, the house price index is flat and in the last 6 months up 2.1%.
Port Moody: Total Units Sold in May were 58 – down from 73 (21%) in April, up from 45 (29%) in March, down from 87 (33%) in May 2023, up from 57 (2%) in May 2022, down from 102 (43%) in May 2021, up from 46 (26%) in May 2020, and up from 62 (6%) in May 2019; Active Listings were at 219 at month end compared to 184 at that time last year (up 19%) and 203 at the end of April (up 8%); New Listings in May were down 24% compared to April 2024, down 9% compared to May 2023, down 28% compared to May 2022, down 21% compared to May 2021, up 26% compared to May 2020, and down 4% compared to May 2019. Month’s supply of total residential listings is up to 4 month’s supply from 3 (seller’s market conditions) and sales to listings ratio of 48% compared to 45% in April 2024, 65% in May 2023, and 34% in May 2022.
Month-over-month, the house price index is up 1.0% and in the last 6 months down 2.2%.
Port Coquitlam: Total Units Sold in May were 95 – down from 102 (7%) in April, up from 89 (10%) in March, up from 91 (4%) in May 2023, up from 91 (4%) in May 2022, down from 165 (42%) in May 2021, up from 60 (58%) in May 2020, and down from 132 (28%) in May 2019; Active Listings were at 278 at month end compared to 153 at that time last year (up 46%) and 254 at the end of April (up 9%); New Listings in May were down 8% compared to April 2024, up 18% compared to May 2023, down 18% compared to May 2022, down 30% compared to May 2021, up 91% compared to May 2020, and down 7% compared to May 2019. Month’s supply of total residential listings is up to 3 month’s supply from 2 (seller’s market conditions) and sales to listings ratio of 55% compared to 54% in April 2024, 62% in May 2023, and 43% in May 2022.
Month-over-month, the house price index is flat and in the last 6 months up 2.9%.
Pitt Meadows: Total Units Sold in May were 30 – down from 32 (6%) in April, up from 29 (3%) in March, down from 39 (23%) in May 2023, up from 24 (25%) in May 2022, down from 54 (44%) in May 2021, up from 23 (30%) in May 2020, and down from 40 (25%) in May 2019; Active Listings were at 94 at month end compared to 71 at that time last year (up 32%) and 71 at the end of April (up 32%); New Listings in May were up 26% compared to April 2024, up 60% compared to May 2023, down 9% compared to May 2022, up 13% compared to May 2021, up 50% compared to May 2020, and up 20% compared to May 2019. Month’s supply of total residential listings is up to 3 month’s supply from 2 (seller’s market conditions) and sales to listings ratio of 41% compared to 56% in April 2024, 86% in May 2023, and 30% in May 2022.
Month-over-month, the house price index is down 0.8% and in the last 6 months up 4.9%.
Maple Ridge: Total Units Sold in May were 172 – down from 191 (10%) in April, down from 187 (8%) in March, down from 218 (21%) in May 2023, down from 178 (3%) in May 2022, down from 286 (40%) in May 2021, up from 111 (55%) in May 2020, and up from 171 (1%) in May 2019; Active Listings were at 850 at month end compared to 539 at that time last year (up 57%) and 817 at the end of April (up 4%); New Listings in May were down 9% compared to April 2024, up 16% compared to May 2023, down 23% compared to May 2022, up 1% compared to May 2021, up 96% compared to May 2020, and up 10% compared to May 2019. Month’s supply of total residential listings is up to 5 month’s supply from 4 (balanced market conditions) and sales to listings ratio of 42% compared to 43% in April 2024, 63% in May 2023, and 39% in May 2022.
Month-over-month, the house price index is up 0.2% and in the last 6 months up 3.3%.
Ladner: Total Units Sold in May were 33 – the as 33 in April, up from 30 (10%) in March, down from 54 (39%) in May 2023, up from 28 (18%) in May 2022, down from 49 (33%) in May 2021, up from 20 (65%) in May 2020, and down from 41 (20%) in May 2019; Active Listings were at 139 at month end compared to 85 at that time last year (up 64%) and 121 at the end of April (up 15%); New Listings in May were down 4% compared to April 2024, up 52% compared to May 2023, up 15% compared to May 2022, up 17% compared to May 2021, up 58% compared to May 2020, and down 12% compared to May 2019. Month’s supply of total residential listings is steady at 4 month’s supply (seller’s market conditions) and sales to listings ratio of 43% compared to 42% in April 2024, 108% in May 2023, and 42% in May 2022.
Month-over-month, the house price index is down 0.1% and in the last 6 months up 3.4%.
Tsawwassen: Total Units Sold in May were 40 – down from 51 (22%) in April, up from 34 (18%) in March, down from 62 (35%) in May 2023, down from 44 (9%) in May 2022, down from 95 (58%) in May 2021, up from 35 (14%) in May 2020, and up from 38 (5%) in May 2019; Active Listings were at 218 at month end compared to 166 at that time last year (up 31%) and 204 at the end of April (up 7%); New Listings in May were down 7% compared to April 2024, up 9% compared to May 2023, down 12% compared to May 2022, down 23% compared to May 2021, up 14% compared to May 2020, and up 5% compared to May 2019. Month’s supply of total residential listings is up to 5 month’s supply from 4 (balanced market conditions) and sales to listings ratio of 40% compared to 48% in April 2024, 68% in May 2023, and 39% in May 2022.
Month-over-month, the house price index is down 0.6% and in the last 6 months up 2.9%.
Fraser Valley: Sales in May were up 3.1%, compared to April and were down 11.3% from April 2023. New listings were down 5.4% from April and up 6.4% from May 2023.The average price was up 2.5% month-over-month and is down 2.2% year-over-year. Active listings were up 8.1% to 7,904 from 7,313 last month and up 42.2% from May 2023 which was at 5,558. The Fraser Valley showed more sales activity in comparison to April this year and May last year, while seeing a slower growth in listings.
“We are seeing an influx of inventory this spring, primarily due to slower than usual spring sales,” said Jeff Chadha, Chair of the Fraser Valley Real Estate Board. “Growing inventory levels are helping to create a healthy balance in the market, giving buyers more options, especially as prices continue to flatten.”