Faith Trumps Fear in This Market Cycle
Download May Sales and Listings Statistics Houses Townhouses Condos
Download May Sales and Listings Statistics All Regional
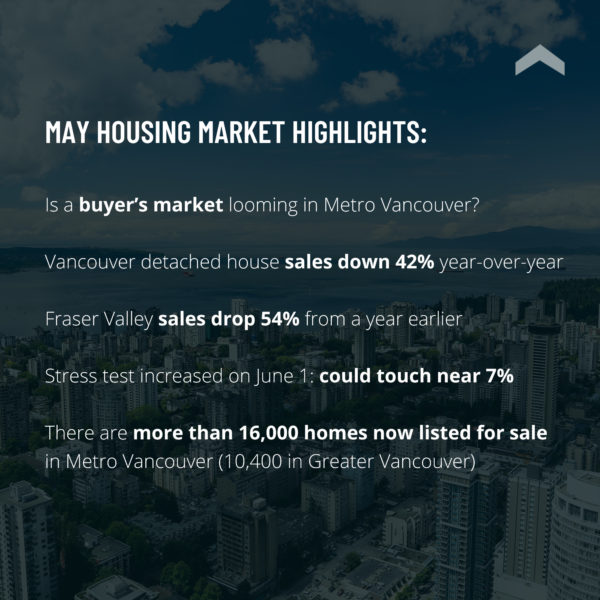
We are not statistically into a buyer’s market in Metro Vancouver but, for all the right reasons, this is when smart buyers are becoming active. As of the end of May there were 10,389 homes listed for sale in Greater Vancouver, including more than 6,400 new listing, the most generous supply in months and the answer to the hopes of homebuyers and economists who had been screaming for more inventory. But it’s still not enough. In the Fraser Valley, May listings had more than tripled from December 2021, with 6,183 homes on the market, up 14.2% from a month earlier.
The new supply is welcomed and needed because in the 12 months ending December 31, 2021, B.C.’s total population grew by 100,566 mostly due to international migration. Immigrants accounted for an increase of 67,141 while net interprovincial migration added another 33,656 to B.C.’s population growth. This means that, on average, B.C. is welcoming more than 8,300 newcomers every month – and an estimated 90% of them settle in the Lower Mainland.
Aside from a welcoming climate and natural beauty, migrants are drawn to B.C. by one of the lowest unemployment rates in Canada and a projected 2022 economic growth of 4.3%, one of the highest in the country.
Despite the influx of people, a combination of price fatigue and higher interest rates slowed housing sales across Greater Vancouver in May compared to the frenzied record-setting pace of 2021. With 2,947 transactions, May 2022 sales were 33% below May of 2021 and nearly 10% lower than in April 2022, which in turn had been 34% lower compared to a month earlier.
Fraser Valley sales in May had dropped 54% from a year earlier, to just 1,360 transactions. This has helped to increase the supply of existing houses and thank goodness because new home starts across Metro Vancouver, which includes Surrey and Langley, were down 22% as of May 1 from a year earlier to only 6,924 units.
May benchmark composite home prices, meanwhile, were just 0.4% lower than a month earlier and up nearly 15% from May of 2021, at $1,261,100. The Fraser Valley saw the first month-over-month home price contraction since September 2019. This market calming was expected, even forecasted here two months ago, but it still has caused a degree of panic in some sectors of the housing market. Let’s take a deep breath here. This is not some global economic crisis, such as the 2008 financial meltdown, or the 2016 and 2018 downturns that were coldly engineered by government policy meant to stifle housing demand.
What we are now seeing is a natural market reaction. The best solution to high prices is high prices, because they eventually stop consumers from buying a product believed to be overpriced. In this case, it is largely the perception of suburban home prices and a sharp increase in lending rates that has halted the most dramatic sales and price increases ever seen in Metro Vancouver. I believe that the current dip in the market is transitory and will perhaps be even shallower than the three corrections we have seen over the past two decades.
And, just as in those cases, those who bought in the dip rode the market to new price and sales highs.
In May of 2008, with Greater Vancouver sales down 34% year-over-year and headlines blaring recession warnings, the benchmark detached house price was $771,250 and a typical condo apartment sold for $389,600. In May 2018, with sales down 35% year-over-year after the introduction of 20% foreign-homebuyer tax, the speculation and vacancy tax, a super property tax on expensive homes and the federal mortgage stress test, the composite benchmark price for residential properties in Greater Vancouver was $1,094,000; the typical detached house sold for $1,608,000.
This May, the composite benchmark price is $200,000 higher than in 2018 and typical detached house is worth $2,093,000, nearly $500,000 more than four years ago. We are not technically into a buyer’s market, since the sales-to-active listing ratio is 29.2% (it is 18.3% for detached houses) in Greater Vancouver and 22% in the Fraser Valley, but for those with their eyes wide open are seeing the best buyer conditions in at least three years. As Bob Dylan once cautioned, changing times means those who are first will later be last and that was apparent in Metro Vancouver’s May housing market. Frankly put, it is suburban markets which are seeing the biggest contraction in home sales and prices.
Maple Ridge, which was posting the highest sales and price increases a year ago, had the largest month-over-month composite price decline in Greater Vancouver in May, dropping 2% from April and it was the only market where prices are now lower than three months ago. May sales of detached houses in Maple Ridge decreased 48% from a year earlier and total sales are down nearly 15%.
Pitt Meadows’ total sales dropped 47% in May, year-over-year. Price exhaustion is kicking in, especially in Pitt Meadows and Maple Ridge with average prices up about 34% year-over year. These areas are likely to be more impacted by interest rate increases as buyers try to stretch their budget to get more. But you can only push so far.
And the push back for some buyers, such as young first-time buyers, became rougher on June 1 as the mortgage stress test was increased to 5.25%, or 2% above the five-year fixed mortgage rate, whichever is higher. As we write this, the typical five-year rate at big banks is 4.59%, which translates to a stress test qualifying rate of 6.59%. This will sideline some homebuyers in the short term, at least.
For all buyers, however, the increased supply of resale listings, flatlining prices and a lack of new housing starts means that right now is the time to be seriously shopping the market and negotiating the best deal possible. Buyers are not yet in the driver’s seat, but the market is steering in that direction.
Here’s a summary of the numbers:
Greater Vancouver: Total housing sales in May were down 10% from April and 33% lower than in May of 2021, at 2947 transactions. The composite benchmark price for all homes was $1,261,1001. This represents a 14.7%c increase over May 2021 and a 0.3% decrease compared to April 2022. This marks the first month-to-month decline in composite home prices since the autumn of 2019. Active Listings were at 10,389 at month end compared to 11,483 at that time last year and 9,176 (up 13%) at the end of April; New Listings in May were up 4% compared to April 2022. The supply of total residential listings is up to 4 month’s (seller’s market conditions) and the sales to listings ratio is 45% compared to 52% in April 2022, and 60% in May 2021.
Vancouver Westside: There is now a healthy 7-month supply of detached houses and 4-month supply of all homes on the Westside, as sales declined. Total May transactions, at 582, were down 27% from year earlier and 5% lower than in April 2022. The composite benchmark home price was down 0.6% from April 2022 and the benchmark detached house price is 1.2% lower at $3,490,000. Condo apartment were the only sector with rising prices month-over-month, up a modest 0.6% to $884,900. Total new Listings in May were down 0.5% compared to April 2022 and down 14% compared to May 2021. The sales-to-listings ratio was 46% compared to 48% in April 2022 and 50% in May 2021 in what remains a weakening seller’s market.
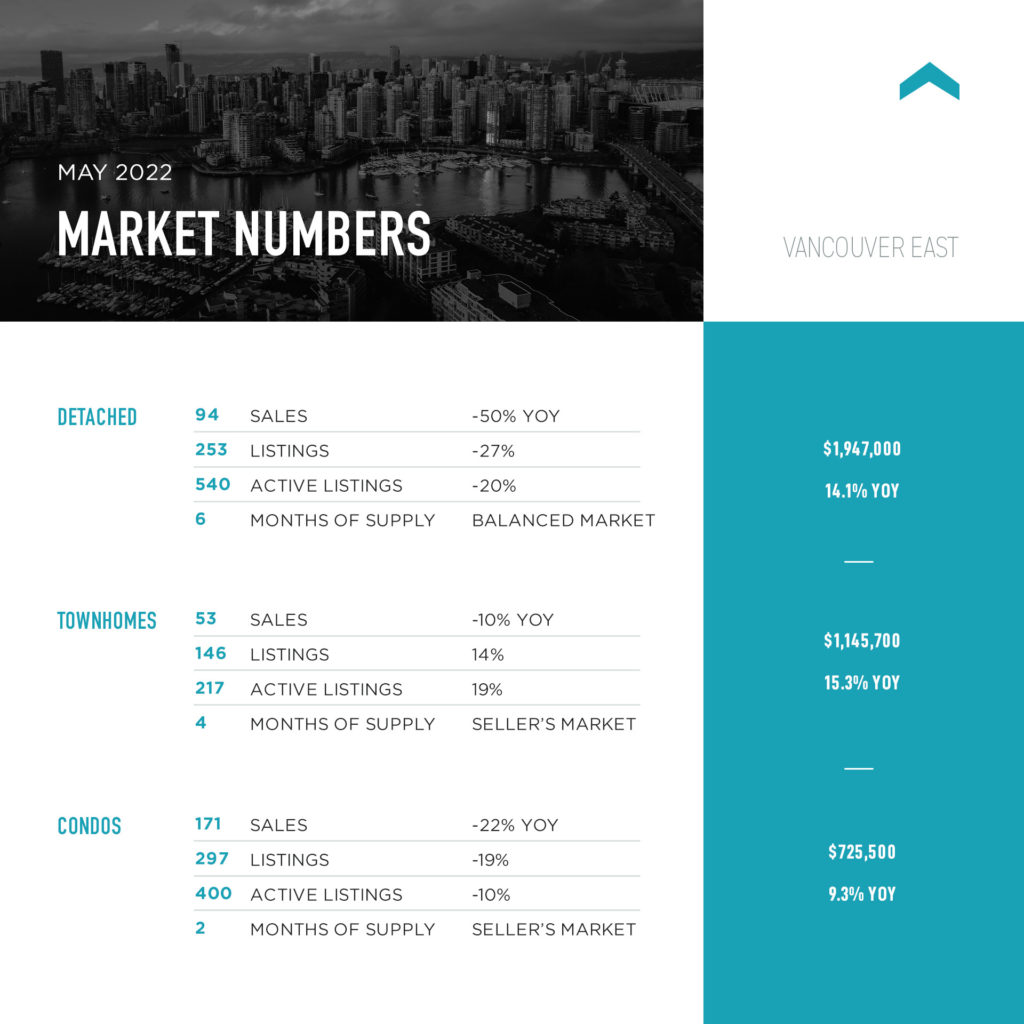
Vancouver East Side: May total sales, at 318, were down 10% from April to the lowest level since January, which is reversal of a normal market. Overall home prices, at $1,249,000, were 0.3% lower, month-over-month, but remain nearly 13% higher than a year earlier. New listings in May were up 4% compared to April 2022 and down 18% compared to May 2021. The supply of total residential listings is up to 4 month’s supply (seller’s market conditions). The sales-to-listings ratio in May was 45% compared to 53% in April 2022 and 56% in May 2021.
North Vancouver: North Vancouver was the outlier performer in May as more properties sold compared to April, with apartment sales up 23% leaving it with just 1 month supply of condos. Total sales in May were 280, up 2% from April 2022, but down 22% compared to May 2021. The benchmark detached house price has been tracking down for 3 months and settled at $2,368,600 in May. Condo prices continue to increase, up a further 1.4% from a month earlier, to $841,600. Total active Listings were at 525 at month end compared to 677 at that time last year and up 6% at the end of April 2022. The sales-to-listings ratio is 58% unchanged from April 2022 and nearly equal to the 60% in May 2021 in what remains very much a seller’s market.
West Vancouver: The most exclusive detached housing market in B.C. is proving itself nearly immune from rising lending rates and higher prices that bedeviled lesser markets in May. Sales of houses were down just 9 units from April but the 46 sales this year were at a median of $3,322,500, $100,000 higher than in April and nearly $200,000 higher compared to May of last year. Total sales in May, at 69, were down 23% from a year earlier. Active listings were 568 at month’s end compared to 611 at that time last year and up 13% from April. New Listings in May were down 9% compared to May 2021. The supply of total listings is up to 8 month’s supply and the sales-to-listings ratio is 28% compared to 30% in April 2022 and 34% in May of last year. Despite the lofty prices, West Vancouver is now seen as a buyer’s market.
Richmond: We were seeing a few price reductions near the end of May as total sales dropped 20% from a month earlier and were down 32% year-over-year, to 341 transactions in the month. The benchmark price for a detached house was nearly 1% lower in May than a month earlier, at $2,178,300. The benchmark price for a condo apartment, which dominated May sales, was up 0.9% from April 2022 at $739,000. Condo sales are tracking lower, however, and won’t be helped by the hike in the mortgage stress test rate on June 1. Total residential new listings were up up 6% compared to April 2022 but down 3% compared to May 2021. The sales to listings ratio also slipped, down to 42% in May as compared to 56% a month earlier.
Ladner: Ladner saw May housing sales drop 43% compared to a year earlier and 18% from a month earlier, to just 28 units as the sales-to-listing ratio fell to 42%, below even pre-pandemic 2019. Meanwhile, active listings increased 23% from a month earlier to 106 at the end of May. Benchmark home prices have flatlined for three months. The typical detached house sold in May for $1.545,000, down 0.1% from a month earlier. There is about a 4-month’s supply of homes on the market.,
Tsawwassen: Sunny Tsawwassen experienced a 44% sales decline in May from a year earlier, with sales also down 3% from April 2022, at 44 transactions. The composite home price was up a slim 0.7% from a month earlier, at $1,353,600. Active listings were at 165 at month end compared to 182 at that time last year and 130 (up 27%) at the end of April; New Listings in May were up 38% compared to April 2022. May’s sales to listings ratio of 39% compared to 56% in April 2022.
Burnaby East: May total housing sales were down 44% in May compared to May 2021 and, at just 30 transactions, were 25% lower than in April. The composite home price was 0.3% lower than a month earlier, led by 0.7% decline in detached house prices to a benchmark of $1,931,700, the lowest house price in Burnaby. The supply of total residential listings is up to a 3 month’s supply and the sales to listings ratio in May was 47% compared to 58% in April 2022 and 68% in May 2021.
Burnaby North: Burnaby North was one of only two markets with more sales in May compared to April, driven by the townhouse and apartment market – a testament to the popularity of this part of Greater Vancouver. The benchmark townhouse price continued to ascend, rising 3.1% from April – the largest increase in Greater Vancouver. Typical condo prices rose 0.8%, month-to-month, to $750,800, the lower condo price in Burnaby. Detached house prices, though, dropped 0.4% from April. This is a strong seller’s market with the sales-to-listing ratio running at 53%, with 175 sales in May and new listings down from both April 2022 and May 2021.
Burnaby South: The rapid appreciation in detached house prices halted in May as benchmark prices dropped almost 1% from a month earlier after rocketing 21.5% over the past year. Still, at a $2,318,000 benchmark, these are Burnaby’s most expensive houses. Total housing sales in May, at 163, were down 12% from April and nearly 30% lower than in May 2021. The supply of total residential listings is steady at 3 month’s supply and sales to listings ratio is a solid 54% in this seller’s market.
New Westminster: The Royal City is one of the suburban markets that was posting impressive sales numbers during the pandemic, but that changed in May. Total sales, at 117, were down 40% from May of 2021 and 13% lower than in April 2022. The overall sales-to-listing ratio dropped to 47% in May, still strong, but well below the 65% in April or the 72% in May of last year. The overall composite benchmark home price was down 0.5% from April to $862,400, the lowest level in Greater Vancouver. This remains a seller’s market, but buyers may soon take the wheel.
Coquitlam: Total housing sales in May were down 39% from a year earlier and 13% from a month earlier. Benchmark prices are down about 1%, month-over-month, across the board to a composite home price of $1,200,600. New Listings in May were down 5% compared to April 2022 and 19% lower than in May 2021. Coquitlam has been one of the stronger markets and buyers are advised to buy the dip. The sales-to-listing ratio is a steady 53% and Coquitlam has a strong upside in all housing sectors.
Port Moody: Port Moody has finally seen an increase in supply, with active listings at 209 as of the end of May, up 48% from a month earlier, with new listings 13% higher than in May 2021. This was partially due to sale slowdown. With 57 transactions, May sales were down 44% from a year earlier. The benchmark composite home price was nearly unchanged from April at $1,225,600, but the sales-to-listing ratio slumped to 34%, down from 55% in April 2022 and the lowest level in at least three years.
Port Coquitlam: Total housing sales in May, at 91, were down 22% from April 2022, and down 45% from May 2021. Active listings were 229 at month’s end compared to 270 at that time last year and up 31% from April 2022. The composite home price dropped month-to-month for the first time since the pre-pandemic, down 1.2% from April at $1,023,900, led by townhouse and detached house prices. The sales-to-listing ratio in May was 43%, down from 62% in April and 66% in May of last year. This market is slowing, and modest price reductions may continue.
Maple Ridge: Total housing sales reversed in May, dropping 38% from a year earlier and down 7% from April to 178 transactions. After posting a 25.3% price increase over the past 12 months, the benchmark composite home price in May dropped 2% in May from April, the biggest month-over-month decline in Greater Vancouver. Still, this remains a seller’s market, with just a 3-month supply of listings and a sales-to-listing ratio of 39%, up from 36% in April.
Pitt Meadows: With a 28% increase in benchmark prices from a year ago, Pitt Meadows detached houses set the highest price increase this year, but prices slipped 1.2% from a month earlier in May to $1,454,800. Condo apartment price were down 0.5% from April to $649,500, while townhouse values were unchanged at $922,900. Active listings were at 84 at the end of May, compared to 63 at that time last year and 51 at the end of April. The sales-to-listings ratio of 30% compares to 77% in April 2022 and 84% in May 2021 in this cooling market.
Surrey: Housing sales in every sector were down dramatically in May, with detached-house transactions dropping 67.7% from May 2022 and down 25.7% from April. Townhouse sales were 49% lower, year-over-year, and sales of condo apartments dropped 42% from a year earlier and 18.9% from April. However, prices held fairly steady. The average detached house price, at $1,848,699, was down 2.7% from April 2022. Condo prices took the biggest hit, dropping 8,4% from April to $592,180, while the average townhouse price slipped 5.5% to $908,527.