The Consistently Inconsistent Real Estate Market!
Download June Sales and Listings Statistics All Regional
Download June Sales and Listings Statistics Houses Townhouses Condos
Highlights of the June 2024 report
- Will July bring the next Bank of Canada Interest rate cut?
- Growth of listings slowed in June
- Buyer activity waned in June
- Is it really a balanced market?
- Expect to see new 15 to 20% less new listings in the fall
With a dash of uncertainty, a promise of more interest rate cuts yet to come and buyer hesitancy a main ingredient, June saw a real estate market with fewer sales and fewer new listings. Activity levels were less than ideal in June, and after a slower start to 2024 it’s not as if everyone needs a break. But that could lead to a more active fall market, like 2019 when the first half of the year produced less sales than the second half of the year, a consistent recovery leading up to the early part of 2020. And interest rates will be coming down, and even if it’s not as quick as we anticipated or as impactful in terms of affordability, it will still provide for a boost for some buyers who’ve been playing the waiting game.
There were 2,418 properties sold in Greater Vancouver in June, after seeing 2,733 sold in May, 2,831 sold in April and 2,415 properties sold in March this year. This was a 19% decrease from the 2,988 properties sold last year in June after a 20% decrease in May from the 3,411 properties sold in May 2023. For the second consecutive month, sales dropped month over month in the region. As new listings remained elevated in June, active listings continued to rise – albeit at a slower pace than the last two months prior to June. Hitting 3,000 sales in a month in Greater Vancouver remains elusive with that level being achieved only once in the last 26 months. The last time this happened was 2012/2013 and 2018/2019. Buyer demand continues to build up and that will eventually unleash into the market. We could see that happen at the beginning of this fall as interest rates continue to decline.
Sales in June were 24% below the 10-year average after being 20% below the 10-year average in May, 12% below the 10-year-average in April and 30% below the 10-year average in March. Consistently inconsistent is the theme of the current real estate market. Not just month by month but area by area. Some regions/product types are showing significant increases in listings while others are struggling to keep up with buyer demand. Sales in the first half of 2024 totaled 13,894 in Greater Vancouver, which was below the 14,529 in the first half of 2023 although higher than the 10,992 in the first half of 2019. If this market continues like 2019, we can expect to see a much busier fall. In fact, sales in July and August 2019 were higher than June that year. It’s not impossible to think that buyers are starting to take notice of the increase in listings and opportunities in the market.
With the increase in new listings and overall absorption remaining at 42%, the months of supply in Greater Vancouver moved up again, now at 6 months (on the border of balanced to buyer’s market). North Vancouver, Burnaby North, New Westminster and Port Moody are the only cities at 4 months supply now while Pitt Meadows remains at 3 months. These areas while technically in seller’s market conditions are showing signs of shifting closer to a balanced market. The number of detached sales in Port Moody dropped down to 6 in June, from 16 in May.
New listing totals declined in Greater Vancouver; much like the number of sales. After seeing 7,229 in April, and 6,484 new listings in May, the total for June dropped down to 5,821. Much like the cool spring weather, maybe some heat in the summer will warm up the market for buyers after sellers ignited the listing counts.
While the number of new listings in June were less than May, they were still higher than the total of 5,468 that came out in June 2023 and the 5,410 that came out in June 2022. Total new listings were slightly below the totals of June 2021 which saw 5,981 come on the market in a year with significantly more sales. Pent-up supply continues to feed the new listings surge we’ve seen, and much like the inconsistencies of the real estate market, where and what types of homes come on the market vary. And the increase in new listings has really come in the last 3 months. Year-over-year, active listings are up 41% in Greater Vancouver, with the increase in the last 3 months alone at 35%. What exactly is driving the increase in listings is difficult to pinpoint and is likely a collection of triggers. Be it capital gains changes, tenancy regulation changes, short term rental changes, or elevated interest rates, all are likely motivating owners to list their homes. Not to mention typical moves that have seemingly been on hold over the last two years.
The number of new listings in June were 2% above the 10-year average after May was 7% above the 10-year average and April was 29% above the 10-year average. Not a surprise to see the number of new listings decline in June as sellers prepare for the end of the school year and look to summer holidays and fun. But in comparison to what we’ve seen in the two months prior, June showed less sellers engaging. Could this be the peak of listing activity for 2024? With the spring market typically being the most active time to list, we aren’t likely to see the number of new listings at the same levels in the fall market. Expect to see new listing amounts 20% to 25% less in the fall.
There were 14,180 active listings in Greater Vancouver at month end, compared to 13,600 at the end of May and 12,491 at the end of April. Compared to this time last year, listings are up 41% from the 9,990 at the end of June 2023 – after being up 46% year-over-year at the end of May. This is the highest number of active listings since the fall of 2019, although not at the levels seen in 2012 when there were nearly 20,000 active listings on the market. Detached active listings are up 30% year-over-year, while townhouses are up 52% and condos are up 53%. Since the end of March though, detached active listings are up 39%, while townhouses are up 37% and condos are up 31%. Are detached homeowners feeling the pinch of higher interest rates? Perhaps not in West Vancouver where detached sales jumped to 43 from 34 in May.
The detached market overall in Greater Vancouver jumped up to 8 months supply from 6 – a buyer’s market. Townhomes and condos moved up to 5 months supply from 4 – shifting both to balanced market conditions in Greater Vancouver. There is a wide variance of supply in the market with some areas like North Vancouver sitting with 3 months supply in condos and townhomes and 4 months supply in detached homes, while Vancouver has 8 months supply of detached homes available.
Overall, the trend is a balanced market, how long that remains is what we’ll see through the rest of 2024. Interest rates and economic conditions will feed into the mindset of buyers and provide signals on when to purchase. Those that take advantage before everyone else could find themselves with the best buying opportunity this decade. While prices will fluctuate with supply and demand changes in the market, overall downward pressure on prices could be limited. And for those areas where listing inventory is still low, prices may be firm and be subject to buyer competition.
Here’s a summary of the numbers:
Greater Vancouver: Total Units Sold in June were 2,418 – down from 2,733 (12%) in May, down from 2,831 (15%) in April, up from 2,415 (0.1%) in March, down from 2,988 (19%) in June 2023, down from 2,466 (2%) in June 2022, down from 3,824 (37%) in June 2021, down from 2,497 (3%) in June 2020, and up from 2,098 (15%) in June 2019; Active Listings were at 14,180 at month end compared to 9,990 at that time last year (up 42%) and 13,600 at the end of May (up 4%); New Listings in June were down 10% compared to May 2024, up 6% compared to June 2023, up 8% compared to June 2022, down 3% compared to June 2021, down 2% compared to June 2020, and up 20% compared to June 2019. Month’s supply of total residential listings is up to 6 month’s supply from 5 (balanced market conditions) and sales to listings ratio of 42% compared to 42% in May 2024, 55% in June 2023, and 46% in June 2022.
Month-over-month, the house price index is down 0.4% and in the last 6 months up 3.5%.
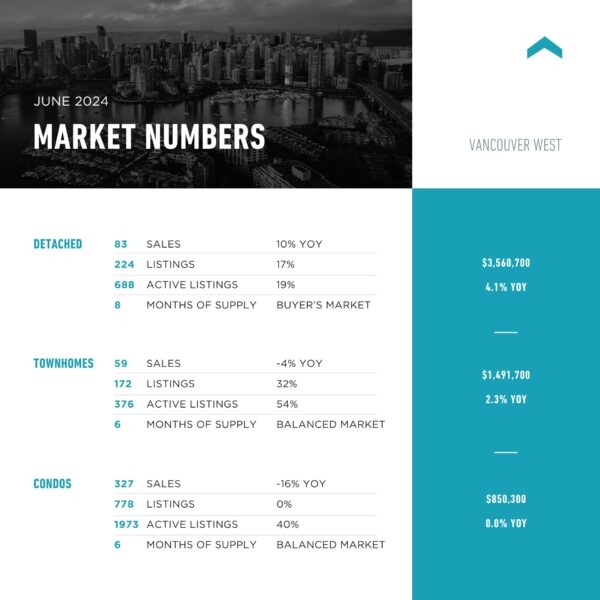
Vancouver Westside: Total Units Sold in June were 470 – down from 501 (6%) in May, down from 471 (0.3%) in April, up from 424 (11%) in March, down from 527 (11%) in June 2023, up from 448 (5%) in June 2022, down from 616 (24%) in June 2021, up from 409 (15%) in June 2020, and up from 355 (32%) in June 2019; Active Listings were at 3,069 at month end compared to 2,249 at that time last year (up 36%) and 2,962 at the end of May (up 4%); New Listings in June were down 11% compared to May 2024, up 7% compared to June 2023, up 9% compared to June 2022, down 9% compared to June 2021, up 1% compared to June 2020, and up 32% compared to June 2019. Month’s supply of total residential listings is up to 7 month’s supply from 6 (balanced market conditions) and sales to listings ratio of 40% compared to 38% in May 2024, 48% in June 2023, and 42% in June 2022.
Month-over-month, the house price index is up 0.5% and in the last 6 months up 4.7%.
Vancouver East Side: Total Units Sold in June were 270 – down from 329 (18%) in May, down from 349 (23%) in April, down from 285 (5%) in March, down from 325 (17%) in June 2023, up from 265 (2%) in June 2022, down from 451 (40%) in June 2021, down from 280 (4%) in June 2020, and up from 215 (26%) in June 2019; Active Listings were at 1,491 at month end compared to 1,082 at that time last year (up 38%) and 1,459 at the end of May (up 2%); New Listings in June were down 11% compared to May 2024, up 4% compared to June 2023, up 12% compared to June 2022, down 6% compared to June 2021, down 1% compared to June 2020, and up 33% compared to June 2019. Month’s supply of total residential listings is up to 6 month’s supply from 4 (from a seller’s market to a balanced market conditions) and sales to listings ratio of 42% compared to 45% in May 2024, 52% in June 2023, and 46% in June 2022.
Month-over-month, the house price index is up 0.4% and in the last 6 months up 3.6%.
North Vancouver: Total Units Sold in June were 221 – down from 245 (10%) in May, down from 248 (11%) in April, up from 187 (18%) in March, down from 247 (11%) in June 2023, up from 199 (11%) in June 2022, down from 322 (31%) in June 2021, down from 239 (8%) in June 2020, and up from 202 (9%) in June 2019; Active Listings were at 793 at month end compared to 553 at that time last year (up 43%) and 796 at the end of May (up 0.4%); New Listings in June were down 14% compared to May 2024, up 15% compared to June 2023, up 2% compared to June 2022, down 1% compared to June 2021, down 14% compared to June 2020, and up 10% compared to June 2019. Month’s supply of total residential listings is up to 4 month’s supply from 3 (seller’s market conditions) and sales to listings ratio of 48% compared to 46% in May 2024, 62% in June 2023, and 43% in June 2022.
Month-over-month, the house price index is up 0.2% and in the last 6 months up 3.6%.
West Vancouver: Total Units Sold in June were 75 (the highest in over a year) – up from 67 (12%) in May, up from 70 (7%) in April, up from 53 (42%) in March, up from 56 (34%) in June 2023, down from 60 (25%) in June 2022, down from 89 (16%) in June 2021, up from 62 (21%) in June 2020, and up from 43 (74%) in June 2019; Active Listings were at 716 at month end compared to 578 at that time last year (up 42%) and 696 at the end of May (up 4%); New Listings in June were down 17% compared to May 2024, down 0.5% compared to June 2023, up 6% compared to June 2022, up 2% compared to June 2021, down 3% compared to June 2020, and up 19% compared to June 2019. Month’s supply of total residential listings is steady at 10 months (buyer’s market conditions) and sales to listings ratio of 35% compared to 26% in May 2024, 26% in June 2023, and 30% in June 2022.
Month-over-month, the house price index is down 0.3% but in the last 6 months up 4.8%.
Richmond: Total Units Sold in June were 263 – down from 299 (12%) in May, down from 336 (22%) in April, down from 279 (3%) in March, down from 362 (27%) in June 2023, down from 337 (22%) in June 2022, down from 472 (46%) in June 2021, down from 272 (3%) in June 2020, and down from 270 (3%) in June 2019; Active Listings were at 1,482 at month end compared to 1,143 at that time last year (up 3%) and 1,440 at the end of May (up 4%); New Listings in June were down 13% compared to May 2024, down 11% compared to June 2023, down 9% compared to June 2022, down 21% compared to June 2021, down 11% compared to June 2020, and down 10% compared to June 2019. Month’s supply of total residential listings is up to 6 month’s supply from 5 (balanced market conditions) and sales to listings ratio of 46% compared to 46% in May 2024, 57% in June 2023, and 54% in June 2022.
Month-over-month, the house price index is down 1.5% and in the last 6 months up 2.4%.
Burnaby East: Total Units Sold in June were 17 – down from 31 (45%) in May, down from 30 (43%) in April, up from 32 (47%) in March, down from 47 (64%) in June 2023, down from 25 (32%) in June 2022, down from 49 (65%) in June 2021, down from 21 (19%) in June 2020, and down from 19 (11%) in June 2019; Active Listings were at 163 at month end compared to 94 at that time last year (up 73%) and 117 at the end of May (up 39%); New Listings in June were up 33% compared to May 2024, up 27% compared to June 2023, up 103% compared to June 2022, up 47% compared to June 2021, up 40% compared to June 2020, and up 62% compared to June 2019. Month’s supply of total residential listings is up to 10 month’s supply from 4 (buyer’s market conditions) and sales to listings ratio of 21% compared to 51% in May 2024, 73% in June 2023, and 63% in June 2022.
Month-over-month, the house price index is down 0.9% and in the last 6 months up 3.8%.
Burnaby North: Total Units Sold in June were 172 – up from 166 (4%) in May, up from 162 (6%) in April, up from 109 (58%) in March, up from 170 (1%) in June 2023, up from 138 (25%) in June 2022, down from 215 (20%) in June 2021, up from 107 (61%) in June 2020, and up from 100 (72%) in June 2019; Active Listings were at 761 at month end compared to 440 at that time last year (up 73%) and 749 at the end of May (up 2%); New Listings in June were down 4% compared to May 2024, up 40% compared to June 2023, up 42% compared to June 2022, up 22% compared to June 2021, up 36% compared to June 2020, and up 62% compared to June 2019. Month’s supply of total residential listings is down to 4 month’s supply from 5 (seller’s market conditions) and sales to listings ratio of 46% compared to 42% in May 2024, 63% in June 2023, and 52% in June 2022.
Month-over-month, the house price index is up 0.2% and in the last 6 months up 2.6%.
Burnaby South: Total Units Sold in June were 135 – up from 127 (6%) in May, down from 143 (6%) in April, down from 142 (5%) in March, down from 174 (22%) in June 2023, down from 144 (6%) in June 2022, down from 217 (38%) in June 2021, up from 93 (45%) in June 2020, and up from 121 (12%) in June 2019; Active Listings were at at 699 end compared to 449 at that time last year (up 56%) and 645 at the end of May (up 8%); New Listings in June were down 6% compared to May 2024, up 14% compared to June 2023, up 16% compared to June 2022, down 8% compared to June 2021, up 13% compared to June 2020, and up 22% compared to June 2019. Month’s supply of total residential listings is steady at 5 month’s supply (balanced market conditions) and sales to listings ratio of 42% compared to 37% in May 2024, 61% in June 2023, and 51% in June 2022.
Month-over-month, the house price index is down 0.9% and in the last 6 months up 2.2%.
New Westminster: Total Units Sold in June were 108 – down from 115 (6%) in May, up from 105 (3%) in April, the same as 108 in March, down from 119 (9%) in June 2023, down from 111 (3%) in June 2022, down from 154 (30%) in June 2021, up from 97 (11%) in June 2020, and up from 97 (11%) in June 2019; Active Listings were at 433 at month end compared to 294 at that time last year (up 47%) and 428 at the end of May (up 1%); New Listings in June were the same as May 2024, up 16% compared to June 2023, up 16% compared to June 2022, down 15% compared to June 2021, down 18% compared to June 2020, and up 6% compared to June 2019. Month’s supply of total residential listings is steady at 5 month’s supply (seller’s market conditions) and sales to listings ratio of 50% compared to 53% in May 2024, 64% in June 2023, and 60% in June 2022.
Month-over-month, the house price index is down 1.9% and in the last 6 months up 2.0%.
Coquitlam: Total Units Sold in June were 189 – down from 228 (17%) in May, down from 238 (21%) in April, down from 235 (20%) in March, down from 267 (29%) in June 2023, the same as June 2022, down from 329 (43%) in June 2021, down from 216 (12%) in June 2020, and up from 177 (7%) in June 2019; Active Listings were at 961 at month end compared to 590 at that time last year (up 63%) and 914 at the end of May (up 5%); New Listings in June were down 12% compared to May 2024, up 5% compared to June 2023, up 24% compared to June 2022, down 0.3% compared to June 2021, up 0.2% compared to June 2020, and up 17% compared to June 2019. Month’s supply of total residential listings is up to 5 month’s supply from 4 (balanced market conditions) and sales to listings ratio of 42% compared to 44% in May 2024, 61% in June 2023, and 51% in June 2022.
Month-over-month, the house price index is down 1.0% and in the last 6 months up 1.8%.
Port Moody: Total Units Sold in June were 56 – down from 58 (3%) in May, down from 73 (23%) in April, up from 45 (24%) in March, down from 97 (42%) in June 2023, down from 57 (2%) in June 2022, down from 95 (41%) in June 2021, down from 59 (5%) in June 2020, and up from 42 (33%) in June 2019; Active Listings were at 241 at month end compared to 194 at that time last year (up 24%) and 219 at the end of May (up 10%); New Listings in June were up 10% compared to May 2024, down 12% compared to June 2023, up 12% compared to June 2022, down 12% compared to June 2021, down 9% compared to June 2020, and up 52% compared to June 2019. Month’s supply of total residential listings is steady at 4 month’s supply (seller’s market conditions) and sales to listings ratio of 43% compared to 48% in May 2024, 64% in June 2023, and 48% in June 2022.
Month-over-month, the house price index is down 0.4% and in the last 6 months up 2.5%.
Port Coquitlam: Total Units Sold in June were 62 – down from 95 (35%) in May, down from 102 (39%) in April, down from 89 (30%) in March, down from 91 (32%) in June 2023, down from 94 (34%) in June 2022, down from 140 (56%) in June 2021, down from 91 (32%) in June 2020, and down from 77 (19%) in June 2019; Active Listings were at 313 at month end compared to 164 at that time last year (up 91%) and 278 at the end of May (up 13%); New Listings in June were down 1% compared to May 2024, up 22% compared to June 2023, up 12% compared to June 2022, up 4% compared to June 2021, up 2% compared to June 2020, and down 2% compared to June 2019. Month’s supply of total residential listings is up to 5 month’s supply from 3 (balanced market conditions) and sales to listings ratio of 36% compared to 55% in May 2024, 65% in June 2023, and 61% in June 2022.
Month-over-month, the house price index is down 0.8% and in the last 6 months up 3.6%.
Pitt Meadows: Total Units Sold in June were 28 – down from 30 (7%) in May, down from 30 (7%) in April, down from 29 (3%) in March, down from 36 (22%) in June 2023, up from 23 (22%) in June 2022, down from 44 (36%) in June 2021, the same as June 2020, and up from 24 (17%) in June 2019; Active Listings were at 97 at month end compared to 67 at that time last year (up 44%) and 94 at the end of May (up 3%); New Listings in June were down 25% compared to May 2024, up 20% compared to June 2023, down 5% compared to June 2022, down 10% compared to June 2021, down 0% compared to June 2020, and up 15% compared to June 2019. Month’s supply of total residential listings remains at 3 month’s supply (seller’s market conditions) and sales to listings ratio of 51% compared to 41% in May 2024, 80% in June 2023, and 40% in June 2022.
Month-over-month, the house price index is down 1.5% and in the last 6 months up 6.1%.
Maple Ridge: Total Units Sold in June were 130 – down from 172 (24%) in May, down from 191 (32%) in April, down from 187 (30%) in March, down from 199 (35%) in June 2023, down from 135 (4%) in June 2022, down from 244 (47%) in June 2021, down from 189 (31%) in June 2020, and down from 132 (2%) in June 2019; Active Listings were at 889 at month end compared to 606 at that time last year (up 46%) and 850 at the end of May (up 5%); New Listings in June were down 12% compared to May 2024, up 0% compared to June 2023, down 12% compared to June 2022, up 29% compared to June 2021, up 7% compared to June 2020, and up 24% compared to June 2019. Month’s supply of total residential listings is up to 7 month’s supply from 5 (balanced market conditions) and sales to listings ratio of 36% compared to 42% in May 2024, 56% in June 2023, and 33% in June 2022.
Month-over-month, the house price index is down 0.3% and in the last 6 months up 3.6%.
Ladner: Total Units Sold in June were 27 – down from 33 (18%) in May, down from 33 (18%) in April, down from 30 (10%) in March, down from 34 (2%1) in June 2023, down from 29 (7%) in June 2022, down from 52 (48%) in June 2021, down from 38 (29%) in June 2020, and down from 33 (18%) in June 2019; Active Listings were at 140 at month end compared to 87 at that time last year (up 61%) and 139 at the end of May (up 1%); New Listings in June were down 21% compared to May 2024, up 9% compared to June 2023, up 9% compared to June 2022, down 13% compared to June 2021, down 2% compared to June 2020, and up 14% compared to June 2019. Month’s supply of total residential listings is up to 5 month’s supply from 4 (balanced market conditions) and sales to listings ratio of 45% compared to 43% in May 2024, 62% in June 2023, and 53% in June 2022.
Month-over-month, the house price index is down 1.6% and in the last 6 months up 3.2%.
Tsawwassen: Total Units Sold in June were 44 – up from 40 (10%) in May, down from 51 (14%) in April, up from 34 (29%) in March, up from 41 (7%) in June 2023, up from 40 (10%) in June 2022, down from 70 (37%) in June 2021, down from 48 (8%) in June 2020, and up from 35 (26%) in June 2019; Active Listings were at 224 at month end compared to 163 at that time last year (up 37%) and 218 at the end of May (up 3%); New Listings in June were down 15% compared to May 2024, up 20% compared to June 2023, up 6% compared to June 2022, down 16% compared to June 2021, down 28% compared to June 2020, and up 6% compared to June 2019. Month’s supply of total residential listings is steady at 5 month’s supply (balanced market conditions) and sales to listings ratio of 52% compared to 40% in May 2024, 59% in June 2023, and 51% in June 2022.
Month-over-month, the house price index is down 2.8% and in the last 6 months up 2.1%.
Fraser Valley: Sales in June were up 13.2%, compared to May and were down 31.9% from June 2023. New listings were down 9.1% from May and down 0.2% from June 2023.The average price was down 5.2% month-over-month and is down 8.3% year-over-year. Active listings were up 5.6% to 8,305 from 7,904 last month and up 40.5% from June 2023 which was at 5,944. Month’s supply of total residential listings is steady at 6 month’s supply (balanced market conditions).
“With seasonally slow sales in June and a steady increase in inventory, we’d expect to see affordability improve,” said Jeff Chadha, Chair of the Fraser Valley Real Estate Board. “However, prices in the Fraser Valley remained relatively flat. That said, despite slow sales, properties that are well-priced are finding buyers, and are subsequently selling within three to four weeks.”
Month-over-month, the house price index is down 0.5% and in the last 6 months up 1.7%.