Will April Listings Bring May Sales?
Download April Sales and Listings Statistics All Regional
Download April Sales and Listings Statistics Houses Townhouses Condos
Highlights of the April 2024 report
Spike in new listings in April – 64% above last year.
Buyers slowly moving back into the market
Townhomes showed a surge in sales in April
Vancouver’s East/West divide in sales activity
With more listings, there must be more sales! Not often talked about but the term pent up supply is something that showed to be true with the surge of listings in April. New listings came on last month like we haven’t seen since the fast-paced market of 2021. With new listings in Greater Vancouver up 41% compared to March, buyers had far more to choose from in many areas. Even with the continued hesitation from the Bank of Canada with perhaps signs of that first interest rate cut coming further out, buyers have some decisions to make. Wait it out or take advantage of long sought after listings and jump on the almost 2% lower fixed rate mortgages that have been available in 2024. Almost like the Canucks waiting for the perfect shot, buyers hesitate for a rate cut that realistically doesn’t impact the mortgage product of almost all buyers since fixed rates are not tied directly to the Bank of Canada Rate. Perhaps the Bank of Canada’s first interest rate cut is a psychological move for buyers more than anything. Ask a mortgage broker, buyers are not taking up variable rate mortgages right now. That pent up demand can only wait so long.
On April 16 the federal government released their annual budget. With a host of promises on building more housing, renter protections and the biggest change proposed being the change in how capital gains are taxed. Going from 50% of the gains being taxed to two thirds being taxed on gains above $250,000 signals that wealth is the target of the Federal Liberal Government. There were ripples through the property market as some owners sought to sell properties prior to the June 25th potential change in capital gains treatment. Short term gain for long term pain. While an attempt to fund programs and perhaps housing, this will be a disincentive to sell property and limit an already tight housing market from seeing more resale homes available for buyers. Metro Vancouver and many parts of Canada do not have a speculation problem, they have a property holding problem. Homeowners focus on keeping the properties they purchase, and this tax change will only intensify that focus. And with new federal and provincial anti-flipping taxes, again, this creates more of a disincentive to sell. Wrong policies at the wrong time. For those with the ability to purchase, it will only add to the value of the property you buy. As much as government policy tries to change the market, supply and demand will ultimately determine what the values are.
And for renters, expect to see landlords selling at a greater pace and less buyers investing to provide private rental stock in the future. Today’s policies, both federally and provincially, do not bode well for the supply of homes going into the future. With less strata resale homes being built, more onerous regulations for landlords, and a signal that investment in the property market is not welcome by our governments, expect this to impact the supply of rental and resale homes.
There were 2,831 properties sold in Greater Vancouver in April after seeing 2,415 properties sold in Greater Vancouver in March and 2,070 properties sold in February this year. This was a 3% increase from the 2,741 properties sold last year in April after a year-over-year decline in March. This is the 4th straight month-over-month gain in the number of properties sold, showing more buyers being enticed to the market by greater selection and adjustments to the current fixed rate mortgages. And in looking at the sales during the month, the pace moved quicker after mid-month which should lead to May producing yet again a month-over-month gain in the number of homes sold. It’s likely we could see a repeat of the sales in last May at 3,400 – which would be the first month over 3,000 sales since then. With the added number of listings, there will be more sales. Just don’t tell the Bank of Canada after their reluctance to decrease its rate during the spring for fears of heating up the spring market.
With April sales up from last year, they were 12% below the 10-year-average after being 30% below the 10-year average in March and 23% below the 10-year-average in February. With demand increasing and even with an increase in the number of listings, multiple offers are still occurring. Some areas and product types continue to be in short supply leaving buyers with the spectre of competition. We are still not yet at balance overall in the market, but buyers have the greatest opportunity they have seen in long time – even with interest rates where they are. Detached homes and condos showed the same level of sales in April compared to last year while townhouse sales were up 16% year-over-year.
Even with the increased listings in April compared to the previous month, there are still only 4 months supply of homes overall in Greater Vancouver, which had fallen from 5 months in February and 6 months in January. Technically this is a seller’s market, but about as streaky a seller’s market as we’ve seen. It makes the Canucks look like a model of consistency. Vancouver’s West Side stayed at 6 months supply, even with a 54% increase in the number of new listings in April compared to March. Vancouver’s East Side stayed at 4 months, still a technical seller’s market, even with a 44% surge in listings compared to March and 78% more compared to April last year. It was the 22% increase in sales month-over-month that kept it at a seller’s market. Amazing how much of a divide there is within the city itself. North Vancouver continues at 3 months supply, surprising given the 82% increase in the number of new listings compared to March. Burnaby climbed to 4 months supply, on the heels of total sales lagging March and April last year, a similar story in New Westminster. Buyer’s take note in those areas! Port Moody showed a 62% month-over-month gain in sales while new listings were up 53% which pushed this market back to 3 month’s supply from 4. And the small markets of Port Coquitlam and Pitt Meadows remain at 2 months supply.
If it seemed like there were more for sale and open house signs out there, that’s because there were 7,229 new listings in Greater Vancouver that came out in April. This was way above last year’s total of 4,399 new listings, producing another consecutive month of year-over-year increase in new listings. And this was the highest number of new listings by month since the spring of 2021, which was a real estate market like no other we’ve seen. Is this rush of listings fuel for a significant increase in sales? It will certainly add to the number of transactions and likely keep prices relatively flat over the next few months.
The number of new listings in April were 29% above the 10-year average after March was at 9% below the 10-year average and February was right at the 10-year average. There was a feeling that many sellers were waiting for the spring market to come before listing, and that came to fruition in April. This is likely a result of pent-up supply and likely some sellers reacting to changes to government legislation for short term rental bans, tenancy changes, property flipping taxes and capital gains changes – oh my. What’s changed in real estate this year? More like what hasn’t.
There were 12,491 active listings in Greater Vancouver at month end, compared to the 10,552 actives at the end of March and 9,634 at the end of February. The count of active listings is up significantly year-over-year though, with there being nearly 3,700 more at the end of April, or 42% more than the end of April 2023. The detached market overall has moved up to 6 months supply from 5.5 in March, keeping it in a balanced market. Vancouver’s East Side is bucking this trend though, sitting with 4 month’s supply and producing some interesting multiple offer sales. Townhomes remain at 3 months supply and condos stayed at 4 months supply – keeping both in seller’s market conditions.
This is not yesterday’s real estate market. And while the numbers overall show seller’s market conditions, savvy buyers, and sellers with the help of their Dexter agent will find market activity will depend on the area and type of property. Look closely at the numbers to understand the market where you are. Absorption rates for detached were down to 33% from 44% while townhouses and condos were 44% and 42% from the previous month at 53% and 48% respectively. There simply are not enough townhomes being built in Metro Vancouver, and this will continue to be one of the most competitive segments of the market.
If April was the bell weather month for listings, will those April listings translate into May sales? Or will the continued hangover of the Bank of Canada pulling their interest rate carrot away from Buyers keep many on the sidelines until that signal comes to start buying. Ask yourself if you are a buyer though, do you want to wait for everyone else or take advantage of a market that’s finally given some choice.
Here’s a summary of the numbers:
Greater Vancouver: Total Units Sold in April were 2,831 – up from 2,415 (17%) in March, up from 2,070 (37%) in February, up from 2,741 (3%) in April 2023, down from 3,281 (14%) in April 2022, down from 5,010 (44%) in April 2021, up from 1,119 (153%) in April 2020, up from 1,850 (53%) in April 2019; Active Listings were at 12,491 at month end compared to 8,790 at that time last year (up 42%) and 10,552 at the end of March (up 18%); New Listings in April were up 41% compared to March 2024, up 64% compared to April 2023, up 15% compared to April 2022, down 10% compared to April 2021, up 201% compared to April 2020, and up 23% compared to April 2019. Month’s supply of total residential listings is steady at 4 month’s supply (seller’s market conditions) and sales to listings ratio of 39% compared to 47% in March 2024, 62% in April 2023, and 52% in April 2022.
Month-over-month, the house price index is up 0.8% and in the last 6 months up 0.8%.
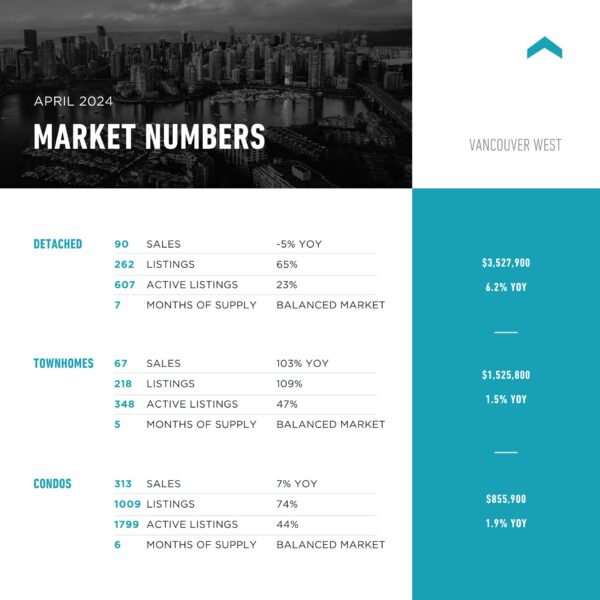
Vancouver Westside: Total Units Sold in April were 471 – up from 424 (11%) in March, up from 374 (26%) in February, up from 468 (3%) in April 2023, down from 619 (24%) in April 2022, down from 764 (38%) in April 2021, up from 195 (142%) in April 2020, up from 342 (38%) in April 2019; Active Listings were at 2,778 at month end compared to 1,992 at that time last year (up 39%) and 2,342 at the end of March (up 19%); New Listings in April were up 54% compared to March 2024, up 78% compared to April 2023, up 17% compared to April 2022, down 3% compared to April 2021, up 235% compared to April 2020, and up 28% compared to April 2019. Month’s supply of total residential listings is steady at 6 month’s supply (balanced market conditions) and sales to listings ratio of 31% compared to 44% in March 2024, 56% in April 2023, and 48% in April 2022.
Month-over-month, the house price index is up 1.0% and in the last 6 months up 1.4%.
Vancouver East Side: Total Units Sold in April were 349 – up from 285 (22%) in March, up from 249 (40%) in February, up from 267 (31%) in April 2023, down from 355 (2%) in April 2022, down from 557 (37%) in April 2021, up from 120 (191%) in April 2020, up from 215 (62%) in April 2019; Active Listings were at 1,369 at month end compared to 939 at that time last year (up 46%) and 1,198 at the end of March (up 14%); New Listings in April were up 44% compared to March 2024, up 78% compared to April 2023, up 28% compared to April 2022, down 17% compared to April 2021, up 248% compared to April 2020, and up 45% compared to April 2019. Month’s supply of total residential listings is steady at 4 month’s supply (seller’s market conditions) and sales to listings ratio of 41% compared to 48% in March 2024, 55% in April 2023, and 53% in April 2022.
Month-over-month, the house price index is up 1.0% and in the last 6 months up 0.4%.
North Vancouver: Total Units Sold in April were 248 – up from 187 (33%) in March, up from 163 (52%) in February, up from 218 (14%) in April 2023, down from 275 (10%) in April 2022, down from 478 (48%) in April 2021, up from 96 (158%) in April 2020, up from 149 (66%) in April 2019; Active Listings were at 711 at month end compared to 495 at that time last year (up 44%) and 523 at the end of March (up 36%); New Listings in April were up 82% compared to March 2024, up 82% compared to April 2023, up 28% compared to April 2022, down 10% compared to April 2021, up 173% compared to April 2020, and up 18% compared to April 2019. Month’s supply of total residential listings is steady at 3 month’s supply (seller’s market conditions) and sales to listings ratio of 41% compared to 56% in March 2024, 66% in April 2023, and 58% in April 2022.
Townhouse new listings were double the amount of April 2023 yet remain with only 2 months supply, while condo inventory saw the biggest jump on the North Shore pushing that segment to 3 months supply. Month-over-month, the house price index is down 0.1% and in the last 6 months no change.
West Vancouver: Total Units Sold in April were 70 – up from 53 (32%) in March, up from 56 (25%) in February, up from 69 (1%) in April 2023, down from 72 (3%) in April 2022, down from 116 (40%) in April 2021, up from 29 (141%) in April 2020, up from 48 (46%) in April 2019; Active Listings were at 628 at month end compared to 491 at that time last year (up 28%) and 560 at the end of March (up 12%); New Listings in April were up 56% compared to March 2024, up 60% compared to April 2023, up 21% compared to April 2022, up 2% compared to April 2021, up 209% compared to April 2020, and up 19% compared to April 2019. Month’s supply of total residential listings is down to 9 month’s supply (buyer’s market conditions) and sales to listings ratio of 24% compared to 28% in March 2024, 38% in April 2023, and 30% in April 2022.
Month-over-month, the house price index is up a shocking 31% but in the last 6 months down 1.2%.
Richmond: Total Units Sold in April were 336 – up from 279 (20%) in March, up from 231 (45%) in February, down from 338 (1%) in April 2023, down from 426 (21%) in April 2022, down from 668 (56%) in April 2021, up from 137 (145%) in April 2020, up from 172 (109%) in April 2019; Active Listings were at 1,339 at month end compared to 1,062 at that time last year (up 26%) and 1,166 at the end of March (up 15%); New Listings in April were up 38% compared to March 2024, up 52% compared to April 2023, up 1% compared to April 2022, down 23% compared to April 2021, up 213% compared to April 2020, and up 10% compared to April 2019. Month’s supply of total residential listings is steady at 4 month’s supply (seller’s market conditions) and sales to listings ratio of 44% compared to 50% in March 2024, 67% in April 2023, and 56% in April 2022.
Townhomes and condo listings saw the slowest growth in this municipality keeping them at 3 months supply while detached homes are up to 6 months. Month-over-month, the house price index is down 0.4% and in the last 6 months up 0.7%.
Burnaby East: Total Units Sold in April were 30 – down from 32 (6%) in March, up from 25 (20%) in February, down from 34 (12%) in April 2023, down from 40 (25%) in April 2022, down from 76 (61%) in April 2021, up from 12 (150%) in April 2020, up from 15 (100%) in April 2019; Active Listings were at 114 at month end compared to 76 at that time last year (up 50%) and 101 at the end of March (up 13%); New Listings in April were up 25% compared to March 2024, up 43% compared to April 2023, down 4% compared to April 2022, down 41% compared to April 2021, up 106% compared to April 2020, and up 16% compared to April 2019. Month’s supply of total residential listings is up to 4 month’s supply (seller’s market conditions) and sales to listings ratio of 45% compared to 60% in March 2024, 81% in April 2023, and 58% in April 2022.
Townhouse supply is the scarcest while keeping it at 2 months supply while detached homes are now at 6 months. Month-over-month, the house price index is up 0.6% and in the last 6 months up 1.7%.
Burnaby North: Total Units Sold in April were 162 – up from 109 (49%) in March, up from 121 (34%) in February, down from 176 (8%) in April 2023, down from 164 (1%) in April 2022, down from 316 (49%) in April 2021, up from 40 (305%) in April 2020, up from 81 (100%) in April 2019; Active Listings were at 700 at month end compared to 415 that time last year (up 69%) and 535 at the end of March (up 31%); New Listings in April were up 53% compared to March 2024, up 77% compared to April 2023, up 33% compared to April 2022, down 0.5% compared to April 2021, up 240% compared to April 2020, and up 65% compared to April 2019. Month’s supply of total residential listings is down to 4 month’s supply (seller’s market conditions) and sales to listings ratio of 35% compared to 36% in March 2024, 67% in April 2023, and 47% in April 2022.
Condo sales are almost double that of March after the push of new listings in March, dropping inventory down to 4 months supply even with overall growth in active listings. Month-over-month, the house price index is up 0.1% and in the last 6 months down 0.5%.
Burnaby South: Total Units Sold in April were 143 – up from 142 (1%) in March, up from 109 (31%) in February, down from 215 (33%) in April 2023, down from 186 (23%) in April 2022, down from 268 (47%) in April 2021, up from 55 (160%) in April 2020, up from 97 (47%) in April 2019; Active Listings were at 537 at month end compared to 385 at that time last year (up 39%) and 446 at the end of March (up 20%); New Listings in April were up 33% compared to March 2024, up 22% compared to April 2023, down 4% compared to April 2022, down 28% compared to April 2021, up 210% compared to April 2020, and up 15% compared to April 2019. Month’s supply of total residential listings is up to 4 month’s supply (seller’s market conditions) and sales to listings ratio of 44% compared to 58% in March 2024, 81% in April 2023, and 55% in April 2022.
Sales overall down to last year, with condo sales less than March and April last year. An area of opportunity. Month-over-month, the house price index is up 1.0% and in the last 6 months up 1.0%.
New Westminster: Total Units Sold in April were 105 – down from 108 (3%) in March, up from 79 (33%) in February, down from 113 (7%) in April 2023, down from 134 (22%) in April 2022, down from 199 (47%) in April 2021, up from 61 (72%) in April 2020, down from 108 (3%) in April 2019; Active Listings were at 408 at month end compared to 238 at that time last year (up 71%) and 350 at the end of March (up 17%); New Listings in April were up 17% compared to March 2024, up 54% compared to April 2023, up 21% compared to April 2022, down 17% compared to April 2021, up 183% compared to April 2020, and down 13% compared to April 2019. Month’s supply of total residential listings is up to 4 month’s supply (seller’s market conditions) and sales to listings ratio of 42% compared to 51% in March 2024, 70% in April 2023, and 65% in April 2022.
Detached sales down 50% to March and off last year’s total, pushing this segment into a buyer’s market. Month-over-month, the house price index is up 0.1% and in the last 6 months up 1.5%.
Coquitlam: Total Units Sold in April were 238 – up from 235 (1%) in March, up from 189 (26%) in February, up from 210 (13%) in April 2023, down from 279 (15%) in April 2022, down from 362 (34%) in April 2021, up from 93 (156%) in April 2020, up from 153 (56%) in April 2019; Active Listings were at 802 at month end compared to 405 at that time last year (up 62%) and 663 at the end of March (up 21%); New Listings in April were up 29% compared to March 2024, up 62% compared to April 2023, up 12% compared to April 2022, down 11% compared to April 2021, up 190% compared to April 2020, and up 18% compared to April 2019. Month’s supply of total residential listings is steady at 3 month’s supply (seller’s market conditions) and sales to listings ratio of 43% compared to 55% in March 2024, 62% in April 2023, and 57% in April 2022.
With townhouse listings slow to come to market in April, sales fell off. While up to 3 months supply, it is still a seller’s market. Month-over-month, the house price index is up 0.3% and in the last 6 months up 0.7%.
Port Moody: Total Units Sold in April were 73 – up from 45 (62%) in March, up from 46 (59%) in February, down from 91 (20%) in April 2023, up from 66 (11%) in April 2022, down from 126 (42%) in April 2021, up from 28 (161%) in April 2020, up from 60 (22%) in April 2019; Active Listings were at 203 at month end compared to 166 at that time last year (up 22%) and 160 at the end of March (up 27%); New Listings in April were up 53% compared to March 2024, up 61% compared to April 2023, down 35% compared to April 2022, down 9% compared to April 2021, up 188% compared to April 2020, and up 11% compared to April 2019. Month’s supply of total residential listings is down to 3 month’s supply (seller’s market conditions) and sales to listings ratio of 45% compared to 43% in March 2024, 91% in April 2023, and 55% in April 2022.
Townhouse sales were the highest since 2021 with limited listings coming on pushed that segment to 1 month supply – time to push for more supply. With only 68 in preliminary planning and 2 projects rejected and withdrawn, there’s little relief coming in this family centric community. Month-over-month, the house price index is up 2.1% and in the last 6 months down 0.6%.
Port Coquitlam: Total Units Sold in April were 102 – up from 89 (15%) in March, up from 64 (59%) in February, up from 76 (34%) in April 2023, down from 117 (13%) in April 2022, down from 167 (39%) in April 2021, up from 42 (143%) in April 2020, up from 67 (52%) in April 2019; Active Listings were at 254 at month end compared to 137 at that time last year (up 85%) and 213 at the end of March (up 19%); New Listings in April were up 36% compared to March 2024, up 146% compared to April 2023, down 1% compared to April 2022, down 27% compared to April 2021, up 144% compared to April 2020, and down 3% compared to April 2019. Month’s supply of total residential listings is steady at 2 month’s supply (seller’s market conditions) and sales to listings ratio of 54% compared to 64% in March 2024, 97% in April 2023, and 61% in April 2022.
Detached sales surged, up 75% year-over-year with townhouse and condo sales not far behind. With only 20 townhomes planned in this community, supply will be scarce in the years to come – can you say missing middle? Month-over-month, the house price index is up 1.3% and in the last 6 months up 1.6%.
Pitt Meadows: Total Units Sold in April were 32 – up from 29 (10%) in March, up from 23 (39%) in February, up from 27 (19%) in April 2023, down from 45 (29%) in April 2022, down from 48 (33%) in April 2021, up from 19 (68%) in April 2020, up from 28 (14%) in April 2019; Active Listings were at 71 at month end compared to 84 at that time last year (down 15%) and 66 at the end of March (up 8%); New Listings in April were up 36% compared to March 2024, up 5% compared to April 2023, down 2% compared to April 2022, down 17% compared to April 2021, up 84% compared to April 2020, and down 21% compared to April 2019. Month’s supply of total residential listings is steady at 2 month’s supply (seller’s market conditions) and sales to listings ratio of 56% compared to 69% in March 2024, 50% in April 2023, and 77% in April 2022.
Month-over-month, the house price index is up 0.9% and in the last 6 months up 4.9%.
Maple Ridge: Total Units Sold in April were 191 – up from 187 (2%) in March, up from 145 (32%) in February, up from 161 (19%) in April 2023, down from 166 (15%) in April 2022, down from 342 (44%) in April 2021, up from 82 (133%) in April 2020, up from 124 (54%) in April 2019; Active Listings were at 817 at month end compared to 506 at that time last year (up 61%) and 714 at the end of March (up 14%); New Listings in April were up 19% compared to March 2024, up 71% compared to April 2023, down 4% compared to April 2022, down 1% compared to April 2021, up 193% compared to April 2020, and up 30% compared to April 2019. Month’s supply of total residential listings is steady at 4 month’s supply (seller’s market conditions) and sales to listings ratio of % 43compared to 50% in March 2024, 62% in April 2023, and 36% in April 2022.
Month-over-month, the house price index is up 1.8% and in the last 6 months up 1.7%.
Ladner: Total Units Sold in April were 33 – up from 30 (10%) in March, up from 23 (43%) in February, down from 43 (23%) in April 2023, down from 34 (3%) in April 2022, down from 74 (59%) in April 2021, up from 17 (94%) in April 2020, up from 29 (14%) in April 2019; Active Listings were at 121 at month end compared to 100 at that time last year (up 21%) and 90 at the end of March (up 34%); New Listings in April were up 49% compared to March 2024, up 36% compared to April 2023, down 41% compared to April 2022, down 14% compared to April 2021, up 119% compared to April 2020, and up 22% compared to April 2019. Month’s supply of total residential listings is up to 4 month’s supply (seller’s market conditions) and sales to listings ratio of 42% compared to 57% in March 2024, 74% in April 2023, and 61% in April 2022.
Month-over-month, the house price index is up 1.5% and in the last 6 months up 1.4%.
Tsawwassen: Total Units Sold in April were 51 – up from 34 (50%) in March, up from 38 (34%) in February, down from 54 (6%) in April 2023, up from 46 (11%) in April 2022, down from 82 (38%) in April 2021, up from 24 (113%) in April 2020, up from 18 (183%) in April 2019; Active Listings were at 204 at month end compared to 167 at that time last year (up 22%) and 172 at the end of March (up 19%); New Listings in April were up 51% compared to March 2024, up 45% compared to April 2023, up 30% compared to April 2022, down 14% compared to April 2021, up 149% compared to April 2020, and down 2% compared to April 2019. Month’s supply of total residential listings is down to to 4 month’s supply (seller’s market conditions) and sales to listings ratio of 48% compared to 48% in March 2024, 73% in April 2023, and 56% in April 2022.
Townhouse inventory is showing little growth with most new product sold out and little on the way. Month-over-month, the house price index is up 1.5% and in the last 6 months up 3.2%.
Fraser Valley: Sales in April were up 5.4%, compared to March and were down 5.3% from April 2023. New listings were up 33.2% from March and up 60.5% from April 2023.The average price was down 1.0% month-over-month and is up 1.8% year-over-year. Active listings were up 18.0% to 7,313 from 6,197 last month and up 57.9% from April 2023 which was at 4,632. Like Greater Vancouver, listings surged in April for the Fraser Valley real estate market, a great opportunity for buyers.
“We are seeing a relatively calm and balanced market right now,” said Jeff Chadha, Chair of the Fraser Valley Real Estate Board. “Which means buyers have time to shop around and purchase a home without the pressure of a few years ago, and while prices are holding fairly steady across all property types.”