This housing cycle is ending. What’s next?
The sales super cycle that the Metro Vancouver housing market has been in for two years is ending. It is nearly over in Fraser Valley, where March sales were down 22.5% from a year earlier and average prices dropped nearly 6% from February 2022, and similarly in Greater Vancouver where home sales were down 25% from March 2021 and averages prices were down 13%. A sure sign that the lower end of the market is thriving more.
Download March Sales and Listings Statistics Houses Townhouses Condos
Download March Sales and Listings Statistics All Regional
This does not mean a major market correction is coming. It does mean that we could be moving back to a calmer, more friendly environment for homebuyers, which would be a welcome relief to many. March saw a number of Greater Vancouver buyers moving quickly to purchase before the next round of lending rate increase, but we expect the sales and price increases to slow in the months ahead comparative to where we have been. Housing sales in March across Greater Vancouver totalled 4,405, down 25% from March 2021, but a 27% increase from February 2022 and 31% above the 10-year March sales average.
More listings were added in March, with 6,802 new listings, still down 20% from a year earlier but 20% above the 10-year average. There were 7,970 total active listings on the Greater Vancouver market at month end which further dropped to 7,851 at the start of April as some listings expired. The after-spring break activity brought an increase of listings to the market that will continue as we move through April.
However, we are still sitting with just a 2-month’s supply of homes available for sale in most areas, with North Vancouver, Burnaby, New Westminster, Coquitlam, Port Moody, Port Coquitlam, Tsawwassen, Pitt Meadows, Maple Ridge and Squamish all at or less than a 1 month’s supply. And while townhouses continue to be the most challenging type of property to find across the region, apartments are fast becoming a scarce product. Even on Vancouver’s West Side, there are only 2-month’s supply of apartments and areas such as Vancouver East and Richmond have dropped down to 1 month supply. It’s even worse in Pitt Meadows where this is half a month’s supply (7 apartments for sale, down from 22 last March), just over half a month’s supply in Maple Ridge and only 6 apartments available for sale in Ladner, again under 1 month’s supply. The number of apartment sales in Coquitlam in March were actually the highest we’ve seen in March at 211, eclipsing the previous high of 187 in March 2021.
It will take a surge in new listings to get this market back to balance, but the question is, will that happen and if so, when? Realistically we would need to see 15,000 to 18,000 active listings to get to a balanced market.
The rest of 2022 may look a lot like it did just before a global pandemic created the most dramatic counterintuitive housing boom this region has ever seen. We seem to forget that, in 2019, Greater Vancouver March housing starts had plunged 31% from a year earlier and were averaging about 1,800 transactions per month, less than half of what they are today. When 2020 started, we saw the market firing at the 10-year average. Perhaps average would be welcome to many.
The true test of the market will be over the next month as interest rates continue to rise, with the Bank of Canada making its next announcement on April 13. It’s a forgone conclusion that the overnight rate will increase. It just remains to be seen whether it will be up 0.25% or 0.5%, thereby increasing variable rate mortgages. Fixed interest rate mortgages have been on the rise with a 5-year interest rate now approaching 4%. Since the federal mortgage stress test qualifying rate is 2% higher, it will be nearly 6% on a 5-year rate. That negatively affects a borrower’s debt-service ratio and their purchasing power.
There are other signs of a cooling market. Continued lack of supply is keeping buyers from being able to find their next home and list their current one. Despite record-setting demand and prices, B.C. housing starts decreased by 4,000 to 31,300 new homes, seasonally adjusted, in February 2022 from a month earlier. Metro Vancouver home starts are down 23% so far this year, compared to 2021. A key reason is developers’ fear of proceeding with projects because of soaring construction costs, especially for wood frame multi-family.
Then there is the uncanny ability for the government to bring in new regulations just when they are not needed. The B.C. finance minister has confirmed that a mandatory ‘cooling-off’ period is coming as their way to protect buyers, especially when competing in multiple offers, which could very well be at a reduced level by the time the legislation is law. The rules will then stick around and simply frustrate buyers and sellers. This in effect will give a buyer a period of days to reconsider their offer and walk away from it. While no details were provided, a monetary penalty could be part of that ability to walk away, which in effect would lock in first time buyers and those without the resources to utilize that strategy. The other option is complete freedom to walk away, but imagine how many properties would be tied up in that process and the potential confusion of that. In an already supplied starved market, what purpose will this really serve? And through all this, there are still some that contend we don’t have a housing supply crisis and in fact supply is keeping pace with population growth. These two wrongs certainly don’t make a right. Mechanisms to supposedly limit demand and a contention that supply isn’t an issue will only further exacerbate the issues we see in the housing market.
Finally, we are seeing price exhaustion. This is apparent now in outlier suburbs, which had seen dramatic price hikes since 2020, but we will also see price increases slowing in central areas, at least through the first half of 2022. Prices can only go up so much.
If you thinking of selling, list now. If you are buying, enjoy the greater selection on the market.
Here’s a summary of the numbers:
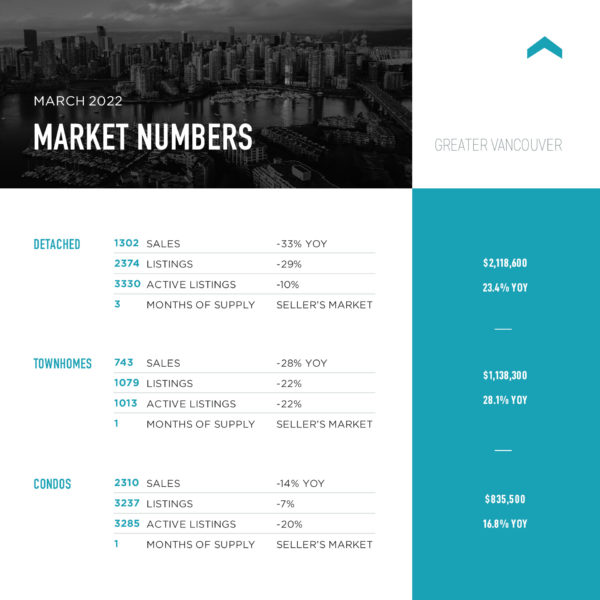
Greater Vancouver: Total housing sales in March were 4,405 – up 27% from February 2022 and down 25% from March 2021. Active Listings were 7,970 at month end compared to 9,633 at that time last year and 7,062 at the end of February. New listings in March were up 22% compared to February 2022, but down 20% compared to March 2021. The sales to listings ratio of 65% compares to 62% in February 2022 and 69% in March 2021. The benchmark composite home price, at $1,360,500, is up 20.7% year-over-year and 3.6% higher than in February. A typical detached house now sells for an all-time high of $2,118,600, up 23.4% from March of 2021.
Vancouver Westside: Total Units Sold in March were 800 – up from 665 (20%) in February 2022, up from 445 (80%) in January 2022, down from 883 (9%) in March 2021, up from 467 (71%) in March 2020 and up from 333 (140%) in March 2019; Active Listings were at 2,065 at month end compared to 2,124 at that time last year and 1,942 at the end of February; New Listings in March were up 24% compared to February 2022, down 10% compared to March 2021, up 61% compared to March 2020 and up 37% compared to March 2019. Month’s supply of total residential listings is still at 3 month’s supply (seller’s market conditions) and sales to listings ratio of 59% compared to 61% in February 2022, 59% in March 2021, 55% in March 2020 and 34% in March 2019. The benchmark composite home price, at $1,469,200, is up 10.3% year-over-year and 2.7% higher than in February.
Vancouver East Side: Total Units Sold in March were 497 – up from 359 (38%) in February 2022, up from 257 (93%) in January 2022, down from 661 (25%) in March 2021, up from 297 (67%) in March 2020 and up from 174 (186%) in March 2019; Active Listings were at 946 at month end compared to 1,027 at that time last year and 891 at the end of February; New Listings in March were up 13% compared to February 2022, down 27% compared to March 2021, up 58% compared to March 2020 and up 44% compared to March 2019. Month’s supply of total residential listings is still at 2 month’s supply (seller’s market conditions) and sales to listings ratio of 68% compared to 55% in February 2022, 66% in March 2021, 64% in March 2020 and 34% in March 2019. The benchmark composite home price, at $1,348,800, is up 14.8% year-over-year and 3.4% higher than in February.
North Vancouver: Total Units Sold in March were 345 – up from 261 (32%) in February 2022, up from 143 (141%) in January 2022, down from 470 (27%) in March 2021, up from 204 (69%) in March 2020 and up from 165 (109%) in March 2019; Active Listings were at 432 at month end compared to 572 at that time last year and 380 at the end of February; New Listings in March were up 20% compared to February 2022, down 31% compared to March 2021, up 37% compared to March 2020 and up 25% compared to March 2019. Month’s supply of total residential listings is still at 1 month’s supply (seller’s market conditions) and sales to listings ratio of 70% compared to 64% in February 2022, 66% in March 2021, 57% in March 2020 and 42% in March 2019. The benchmark composite home price, at $1,418,900, is up 19.9% year-over-year and 3.2% higher than in February.
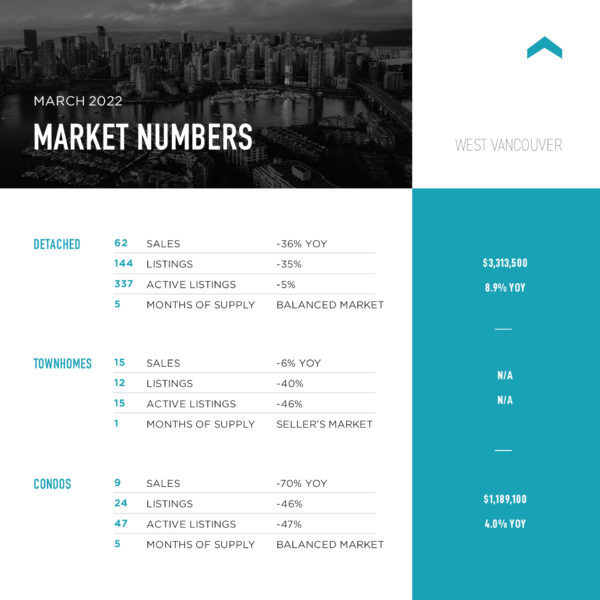
West Vancouver: Total Units Sold in March were 87 – up from 80 (9%) in February 2022, up from 45 (93%) in January 2022, down from 148 (41%) in March 2021, up from 56 (55%) in March 2020 and up from 34 (156%) in March 2019; Active Listings were at 423 at month end compared to 491 at that time last year and 417 at the end of February; New Listings in March were down 16% compared to February 2022, down 37% compared to March 2021, up 9% compared to March 2020 and up 9% compared to March 2019. Month’s supply of total residential listings is still at 5 month’s supply (seller’s to balanced market conditions) and sales to listings ratio of 47% compared to 37% in February 2022, 51% in March 2021, 33% in March 2020 and 20% in March 2019. The benchmark composite home price, at $2,677,500, is up 7.7% year-over-year and 2.7% higher than in February.
Richmond: Total Units Sold in March were 557 – up from 397 (40%) in February 2022, up from 340 (64%) in January 2022, down from 768 (28%) in March 2021, up from 337 (65%) in March 2020 and up from 178 (212%) in March 2019; Active Listings were at 1,076 at month end compared to 1,411 at that time last year and 924 at the end of February; New Listings in March were up 26% compared to February 2022, down 18% compared to March 2021, up 69% compared to March 2020 and up 31% compared to March 2019. Month’s supply of total residential listings is still at 2 month’s supply (seller’s market conditions) and sales to listings ratio of 63% compared to 62% in February 2022, 56% in March 2021, 64% in March 2020 and 27% in March 2019. The benchmark composite home price, at $1,249,500, is up 20.2% year-over-year and 3.0% higher than in February.
Burnaby East: Total Units Sold in March were 56 – up from 34 (65%) in February 2022, up from 25 (124%) in January 2022, down from 70 (20%) in March 2021, up from 27 (107%) in March 2020 and up from 17 (229%) in March 2019; Active Listings were at 59 at month end compared to 100 at that time last year and 56 at the end of February; New Listings in March were up 3% compared to February 2022, down 34% compared to March 2021, up 40% compared to March 2020 and up 31% compared to March 2019. Month’s supply of total residential listings is down to 1 month’s supply (seller’s market conditions) and sales to listings ratio of 84% compared to 52% in February 2022, 69% in March 2021, 56% in March 2020 and 33% in March 2019. The benchmark composite home price, at $1,282,300, is up 24.8% year-over-year and 4.0% higher than in February.
Burnaby North: Total Units Sold in March were 257 – up from 226 (14%) in February 2022, up from 142 (81%) in January 2022, down from 335 (23%) in March 2021, up from 130 (98%) in March 2020 and up from 77 (233%) in March 2019; Active Listings were at 315 at month end compared to 461 at that time last year and 283 at the end of February; New Listings in March were up 13% compared to February 2022, down 22% compared to March 2021, up 59% compared to March 2020 and up 57% compared to March 2019. Month’s supply of total residential listings is still at 1 month’s supply (seller’s market conditions) and sales to listings ratio of 73% compared to 72% in February 2022, 74% in March 2021, 59% in March 2020 and 34% in March 2019. The benchmark composite home price, at $1,262,100, is up 19.6% year-over-year and 3.2% higher than in February.
Burnaby South: Total Units Sold in March were 213 – up from 200 (7%) in February 2022, up from 150 (42%) in January 2022, down from 325 (34%) in March 2021, up from 143 (49%) in March 2020 and up from 97 (120%) in March 2019; Active Listings were at 395 at month end compared to 565 at that time last year and 312 at the end of February; New Listings in March were up 26% compared to February 2022, down 23% compared to March 2021, up 64% compared to March 2020 and up 117% compared to March 2019. Month’s supply of total residential listings is still at 2 month’s supply (seller’s market conditions) and sales to listings ratio of 59% compared to 70% in February 2022, 70% in March 2021, 65% in March 2020 and 33% in March 2019. The benchmark composite home price, at $1,192,400, is up 18.2% year-over-year and 3.0% higher than in February.
New Westminster: Total Units Sold in March were 204 – up from 159 (28%) in February 2022, up from 102 (100%) in January 2022, down from 245 (17%) in March 2021, up from 118 (73%) in March 2020 and up from 81 (152%) in March 2019; Active Listings were at 215 at month end compared to 345 at that time last year and 190 at the end of February; New Listings in March were up 15% compared to February 2022, down 22% compared to March 2021, up 30% compared to March 2020 and up 28% compared to March 2019. Month’s supply of total residential listings is still at 1 month’s supply (seller’s market conditions) and sales to listings ratio of 78% compared to 70% in February 2022, 73% in March 2021, 59% in March 2020 and 40% in March 2019. The benchmark composite home price, at $846,000, is up 23.0% year-over-year and 3.6% higher than in February.
Coquitlam: Total Units Sold in March were 400 – up from 264 (52%) in February 2022, up from 174 (130%) in January 2022, down from 462 (13%) in March 2021, up from 202 (98%) in March 2020 and up from 142 (182%) in March 2019; Active Listings were at 508 at month end compared to 574 at that time last year and 419 at the end of February; New Listings in March were up 36% compared to February 2022, down 2% compared to March 2021, up 55% compared to March 2020 and up 47% compared to March 2019. Month’s supply of total residential listings is down to 1 month’s supply (seller’s market conditions) and sales to listings ratio of 66% compared to 59% in February 2022, 74% in March 2021, 52% in March 2020 and 35% in March 2019. The benchmark composite home price, at $1,325,900, is up 27.7% year-over-year and 4.8% higher than in February.
Port Moody: Total Units Sold in March were 107 – up from 87 (23%) in February 2022, up from 57 (88%) in January 2022, down from 134 (20%) in March 2021, up from 54 (98%) in March 2020 and up from 38 (182%) in March 2019; Active Listings were at 121 at month end compared to 162 at that time last year and 97 at the end of February; New Listings in March were up 25% compared to February 2022, down 19% compared to March 2021, up 44% compared to March 2020 and up 58% compared to March 2019. Month’s supply of total residential listings is still at 1 month’s supply (seller’s market conditions) and sales to listings ratio of 71% compared to 73% in February 2022, 72% in March 2021, 52% in March 2020 and 40% in March 2019. The benchmark composite home price, at $1,256,300, is up 24.9% year-over-year and 6.7% higher than in February.
Port Coquitlam: Total Units Sold in March were 141 – up from 108 (31%) in February 2022, up from 77 (83%) in January 2022, down from 205 (31%) in March 2021, up from 96 (47%) in March 2020 and up from 59 (139%) in March 2019; Active Listings were at 146 at month end compared to 209 at that time last year and 102 at the end of February; New Listings in March were up 37% compared to February 2022, down 33% compared to March 2021, up 48% compared to March 2020 and up 25% compared to March 2019. Month’s supply of total residential listings is still at 1 month’s supply (seller’s market conditions) and sales to listings ratio of 67% compared to 71% in February 2022, 65% in March 2021, 68% in March 2020 and 35% in March 2019. The benchmark composite home price, at $1,146,600, is up 28.9% year-over-year and 5.6% higher than in February.
Pitt Meadows: Total Units Sold in March were 55 – up from 35 (57%) in February 2022, up from 30 (83%) in January 2022, up from 53 (4%) in March 2021, up from 35 57%) in March 2020 and up from 24 (129%) in March 2019; Active Listings were at 53 at month end compared to 53 at that time last year and 37 at the end of February; New Listings in March were up 62% compared to February 2022, up 3% compared to March 2021, up 23% compared to March 2020 and up 47% compared to March 2019. Month’s supply of total residential listings is just under 1 month’s supply (seller’s market conditions) and sales to listings ratio of 67% compared to 70% in February 2022, 67% in March 2021, 53% in March 2020 and 43% in March 2019. The benchmark composite home price, at $1,142,600, is up 32.4% year-over-year and 5.1% higher than in February.
Maple Ridge: Total Units Sold in March were 264 – up from 224 (18%) in February 2022, up from 124 (113%) in January 2022, down from 437 (40%) in March 2021, up from 170 (55%) in March 2020 and up from 116 (128%) in March 2019; Active Listings were at 390 at month end compared to 398 at that time last year and 301 at the end of February; New Listings in March were up 22% compared to February 2022, down 19% compared to March 2021, up 47% compared to March 2020 and up 69% compared to March 2019. Month’s supply of total residential listings is still at 1 month’s supply (seller’s market conditions) and sales to listings ratio of 60% compared to 62% in February 2022, 80% in March 2021, 57% in March 2020 and 44% in March 2019. The benchmark composite home price, at $1,275,300, is up 37.3% year-over-year and 5.4% higher than in February.
Ladner: Total Units Sold in March were 46 – up from 26 (77%) in February 2022, up from 22 (109%) in January 2022, down from 104 (56%) in March 2021, up from 32 (44%) in March 2020 and up from 25 (149%) in March 2019; Active Listings were at 79 at month end compared to 115 at that time last year and 62 at the end of February; New Listings in March were up 28% compared to February 2022, down 45% compared to March 2021, up 9% compared to March 2020 and down 5% compared to March 2019. Month’s supply of total residential listings is still at 2 month’s supply (seller’s market conditions) and sales to listings ratio of 63% compared to 46% in February 2022, 78% in March 2021, 48% in March 2020 and 32% in March 2019. The benchmark composite home price, at $1,247,800, is up 27.3% year-over-year and 2.9% higher than in February.
Tsawwassen: Total Units Sold in March were 78 – up from 73 (7%) in February 2022, up from 42 (86%) in January 2022, down from 106 (26%) in March 2021, up from 39 (100%) in March 2020 and up from 15 (420%) in March 2019; Active Listings were at 105 at month end compared to 166 at that time last year and 101 at the end of February; New Listings in March were down 8% compared to February 2022, down 33% compared to March 2021, up 24% compared to March 2020 and up 9% compared to March 2019. Month’s supply of total residential listings is still at 1 month’s supply (seller’s market conditions) and sales to listings ratio of 82% compared to 72% in February 2022, 77% in March 2021, 52% in March 2020 and 18% in March 2019. The benchmark composite home price, at $1,356,100, is up 23.0% year-over-year and 3.1% higher than in February.