Will The Spaghetti Stick?
Download May Sales and Listings Statistics All Regional
Download May Sales and Listings Statistics Houses Townhouses Condos
Highlights of the May 2025 report
Buyers are throwing more offers against listings
Active listing count continues to rise, but at a slower pace
Sales continue to increase month over month
Bank of Canada stays the course for now
Month by month, sales have increased in 2025, although not at the pace familiar to the Metro Vancouver housing market. Even with this slower pace, there appears to be signs of increased buyer activity. And it might just be that buyers are throwing spaghetti against the wall. Offers sent out to see if they will stick. Buyers know they have choice and are exercising it liberally. Some sellers are coming down to meet buyers and the spaghetti is sticking, where others aren’t and it’s falling away. Expect the trend of more offers sticking to continue through the next few months.
May was for the most part a month of reprieve from elections, Bank of Canada decisions and tariff talks – until the very end of the month. In comes June, with the Bank of Canada meeting on June 4th and potential fallout from an increase in tariffs for steel and aluminum. Of course, tariff threats can change direction quicker than emails can be opened. The Canadian government has its work cut out for it, but they talk a good game promising better housing affordability through record supply and tax cuts while transforming the Canadian economy, all told when their throne speech was read out by King Charles. If they can bring some stability to the rhetoric from down south, it may help to get buyers more excited about real estate. While the Bank of Canada paused rate cuts again this month due to sticky inflation and GDP numbers showing some life in the economy – albeit front loaded from early purchases at the start of 2025 to avoid said tariffs, these pauses can’t last forever. But let’s not focus on interest rates, they are at levels matching the 10-year average. Confidence is what needs to be driving the real estate market, and the lack there of it, is keeping sales down.
There were 2,228 properties sold in Greater Vancouver in May, after 2,163 properties sold in April, 2,091 properties sold in March, and 1,827 properties sold in February. Uncertainty continued to keep buyers on the sidelines through May, much like the previous months this year. Imagine how many people are in the wrong homes and wishing they weren’t. Much like a box of chocolates though, you don’t know what each neighbourhood is doing until you dig into them. Some slowed in May while others pushed ahead. Take West Vancouver which saw sales double in May from April and achieve the highest monthly sales since June of last year. While areas like Vancouver West, Port Coquitlam and Pitt Meadows saw less sales in May compared to April. In a market where price sensitivity is one of the most important, condo sales slowed in May compared to April, down 4%. It took a 25% off sale in Surrey to get buyers back to the table at that project.
Even though Greater Vancouver home sales in May have outpaced the previous months in 2025 so far, sales levels are still well below last year. Sales in May were down 18% compared to May last year after sales in April were down 24% compared to April last year. West Vancouver, Burnaby East, Port Moody, Tsawwassen Squamish showed sales increases over May of last year. Perhaps the bright side of where sales in May tallied is that the month of May typically lags April. While only a slight gain over April, an improvement it was.
Heading east, the Fraser Valley region saw sales in May down 22% compared to May last year after being down 29% in April this year compared to April 2024. Although, compared to Greater Vancouver, sales were up much more month-over-month in May, showing 15% growth compared to April. Much better than the 3% month-over-month gain in Greater Vancouver. The Fraser Valley is showing signs of buyer engagement.
Greater Vancouver sales in May were 30% below the 10-year average, compared to April at 31% below the 10-year average, March at 35% below the 10-year average, and February at 39% below the 10-year average. Outside of 2020, total home sales in May were the lowest going back to the last two years of the 1900’s. It’s hard to believe that May 1991 saw 3800 sales with much less people and far fewer homes available in Greater Vancouver. Pent up demand is a thing and it’s growing by the day.
Sellers slowed down slightly in May with 6,728 new listings hitting the MLS® last month. This compared with April where 6,952 new listings came on, March with 6,565 new listings and 5,163 new listings in February. And while the absorption rate rose to 33% in May, it was only just above April at 31%, and March at 32%. Only a third of new listings are selling in 2025, which has caused the number of for sale signs in Metro Vancouver to swell with many staying up longer without “sold” on them. It’s at the point where availability of for sale signs has become a challenge in some areas. Sellers aren’t slowing enough though, so we’re going to need more signs.
The number of new listings in May were 9% above the 10-year average after April was 19% above the 10-year average and compared with March at 15% above the 10-year average.
There were 17,094 active listings in Greater Vancouver at month end compared to 16,207 active listings at the end of April, and 14,546 at the end of March. Total active listings are up from 13,600 at the end of May last year, a 26% year-over-year increase. This number has been steadily falling though, with April at a 30% increase year-over-year, and March at 38% year-over-year. There are several listings that get recycled after being cancelled and then brought back on the market at a lower price as well. And as we get closer to the summer months, expect to see some sellers come off the market either for the summer or until the market is more in favour of sellers.
Months of supply increased to 8 in May from 7 months in April pushing the region into more of a buyer’s market. With active listings climbing and sales growth slow, it’s not surprising to see Greater Vancouver move into this buyer’s market. But what an opportunity for buyers. Expect to see more spaghetti thrown against the walls over the next few months as buyers take advantage of the greatest buying opportunity we’ve seen in many years.
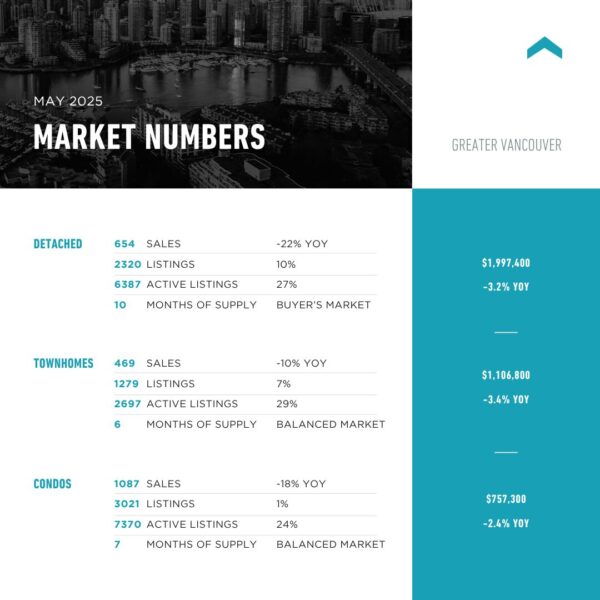
The detached market in Greater Vancouver remained at 10 months supply which is a solid buyer’s market, while townhomes remained at 6 months and condos increased to 7 months supply on the heels of a slower month – keeping those in a balanced market. In the Fraser Valley, months of supply dropped down to 8 months from 10 months, with detached dropping to 10 months supply from 11 months, townhomes remaining at 6 months and condos climbing to 8 months supply from 7.
Greater Vancouver townhome sales in May were down 10% compared to May last year, while condos sales were down 18% year-over-year. Detached sales struggled again compared to last year, down 22% from May last year. Townhome inventory was up 29% year-over year compared to 32% up at the end of April, while condo inventory dropped to 24% above May 2024 after being up 32% in April year-over-year. Detached homes were up 27% year-over-year, compared to being up 26% at the end of April. Over in the Fraser Valley, detached home inventory is up 24% year-over-year compared to 36% at the end of April while townhome inventory is up 40% year-over-year after being up 57% at the end of April and up 72% year-over-year at the end of March. Condo inventory is up 31% year-over-year after being up 45% at the end of April and 67% year-over-year at the end of March. Surrey and Delta continue to struggle with inflated inventory and slower sales, while areas east like Abbotsford and Aldergrove performed better year-over-year in May.
Despite ongoing economic uncertainties and a slower-than-usual pace for Metro Vancouver’s housing market, 2025 has seen steady month-over-month sales growth, with May continuing that trend. Increased buyer activity, encouraged by greater choice and moderating prices, signals growing confidence. While total sales remain below historical and year-over-year averages, regions like West Vancouver and parts of the Fraser Valley posted strong gains, highlighting a patchwork of momentum across neighborhoods. Inventory levels are up, creating a clear buyer’s market, and with interest rates stabilizing and pent-up demand growing, many see this as one of the best buying opportunities in recent years.
Here’s a summary of the numbers:
Greater Vancouver: Total Units Sold in May were 2,228 – up from 2,163 (3%) in April, up from 2,091 (7%) in March, up from 1,827 (22%) in February, down from 2,733 (18%) in May 2024, and down from 3,411 (35%) in May 2023; Active Listings were at 17,094 at month end compared to 13,600 at that time last year (up 26%) and 16,207 at the end of April (up 5%); the 6,728 New Listings in May were down 3% compared to April, up 2% compared to March, up 30% compared to February, up 4% compared to May 2024, and up 16% compared to May 2023. Month’s supply of total residential listings is up to 8 month’s supply from 7 (buyer’s market conditions) and sales to listings ratio of 33% compared to 31% in April, 42% in May 2024, and 59% in May 2023.
Month-over-month, the house price index is down 0.6% and in the last 12 months down 2.9%.
Vancouver Westside: Total Units Sold in May were 412 – down from 427 (4%) in April, up from 394 (5%) in March, up from 307 (34%) in February, down from 501 (18%) in May 2024, and down from 624 (34%) in May 2023; Active Listings were at 3,393 at month end compared to 2,962 at that time last year (up 15%) and 3,306 at the end of April (up 3%); the 1,270 New Listings in May were down 3% compared to April, down 3% compared to March, up 19% compared to February, down 4% compared to May 2024, and up 8% compared to May 2023. Month’s supply of total residential listings is steady at 8 month’s supply (buyer’s market conditions) and sales to listings ratio of 32% compared to 33% in April, 38% in May 2024, and 53% in May 2023.
Month-over-month, the house price index is down 1.0% and in the last 12 months down 1.7%.
Vancouver East Side: Total Units Sold in May were 245 – up from 242 (1%) in April, down from 247 (1%) in March, up from 204 (20%) in February, down from 329 (26%) in May 2024, and down from 360 (32%) in May 2023; Active Listings were at 1,729 at month end compared to 1,459 at that time last year (up 19%) and 1,658 at the end of April (up 4%); the 766 New Listings in May were up 5% compared to April, up 5% compared to March, up 35% compared to February, up 6% compared to May 2024, and up 18% compared to May 2023. Month’s supply of total residential listings is steady at 7 month’s supply (balanced market conditions) and sales to listings ratio of 32% compared to 33% in April, 45% in May 2024, and 56% in May 2023.
Month-over-month, the house price index is down 0.5% and in the last 12 months down 0.9%.
North Vancouver: Total Units Sold in May were 203 – down from 204 (0.5%) in April, up from 171 (19%) in March, up from 153 (33%) in February, down from 245 (17%) in May 2024, and down from 288 (30%) in May 2023; Active Listings were at 1,071 at month end compared to 796 at that time last year (up 35%) and 1,016 at the end of April (up 5%); the 565 New Listings in May were down 11% compared to April, up 10% compared to March, up 61% compared to February, up 6% compared to May 2024, and up 29% compared to May 2023. Month’s supply of total residential listings is steady at 5 month’s supply (balanced market conditions) and sales to listings ratio of 36% compared to 32% in April, 46% in May 2024, and 66% in May 2023.
Month-over-month, the house price index is up 1.6% and in the last 12 months down 1.9%.
West Vancouver: Total Units Sold in May were 68 – up from 38 (79%) in April, up from 40 (70%) in March, up from 39 (74%) in February, down from 67 (1%) in May 2024, and down from 80 (15%) in May 2023; Active Listings were at 743 at month end compared to 696 at that time last year (up 7%) and 718 at the end of April (up 3%); the 229 New Listings in May were down 18% compared to April, up 11% compared to March, up 29% compared to February, down 12% compared to May 2024, and down 1% compared to May 2023. Month’s supply of total residential listings is down to 11 month’s supply from 19 (buyer’s market conditions) and sales to listings ratio of 30% compared to 14% in April, 26% in May 2024, and 35% in May 2023.
Month-over-month, the house price index is down 2.6% but in the last 12 months down 6.0%.
Richmond: Total Units Sold in May were 231 – up from 213 (8%) in April, up from 220 (5%) in March, up from 179 (29%) in February, down from 299 (23%) in May 2024, and down from 396 (42%) in May 2023; Active Listings were at 2,047 at month end compared to 1,440 at that time last year (up 42%) and 1,908 at the end of April (up 7%); the 737 New Listings in May were the same as April, up 1% compared to March, up 23% compared to February, up 14% compared to May 2024, and up 14% compared to May 2023. Month’s supply of total residential listings is steady at 9 month’s supply (buyer’s market conditions) and sales to listings ratio of 31% compared to 29% in April, 46% in May 2024, and 61% in May 2023.
Month-over-month, the house price index is down 1.2% and in the last 12 months down 5.2%.
Burnaby East: Total Units Sold in May were 32 – up from 24 (33%) in April, up from 27 (19%) in March, up from 21 (52%) in February, down from 31 (3%) in May 2024, and down from 39 (18%) in May 2023; Active Listings were at 227 at month end compared to 117 at that time last year (up 94%) and 201 at the end of April (up 13%); the 100 New Listings in May were up 15% compared to April, up 18% compared to March, up 54% compared to February, up 64% compared to May 2024, and up 47% compared to May 2023. Month’s supply of total residential listings is down to 7 month’s supply from 8 (balanced market conditions) and sales to listings ratio of 32% compared to 28% in April, 51% in May 2024, and 57% in May 2023.
Month-over-month, the house price index is down 3.1% and in the last 12 months down 7.0%.
Burnaby North: Total Units Sold in May were 140 – the same as April, up from 107 (31%) in March, up from 129 (9%) in February, down from 166 (16%) in May 2024, and down from 195 (28%) in May 2023; Active Listings were at 954 at month end compared to 749 at that time last year (up 27%) and 940 at the end of April (up 1%); the 360 New Listings in May were down 11% compared to April, down 16% compared to March, up 12% compared to February, down 8% compared to May 2024, and up 17% compared to May 2023. Month’s supply of total residential listings is steady at 7 month’s supply (balanced market conditions) and sales to listings ratio of 39% compared to 35% in April, 42% in May 2024, and 63% in May 2023.
Month-over-month, the house price index is down 1.8% and in the last 12 months down 3.8%.
Burnaby South: Total Units Sold in May were 90 – down from 97 (7%) in April, down from 94 (4%) in March, up from 75 (20%) in February, down from 127 (29%) in May 2024, and down from 233 (61%) in May 2023; Active Listings were at 821 at month end compared to 645 at that time last year (up 27%) and 754 at the end of April (up 9%); the 317 New Listings in May were down 2% compared to April, up 11% compared to March, up 28% compared to February, down 8% compared to May 2024, and down 1% compared to May 2023. Month’s supply of total residential listings is up to 9 month’s supply from 8 (buyer’s market conditions) and sales to listings ratio of 28% compared to 30% in April, 37% in May 2024, and 73% in May 2023.
Month-over-month, the house price index is down 1.5% and in the last 12 months down 4.4%.
New Westminster: Total Units Sold in May were 92 – up from 87 (6%) in April, down from 104 (12%) in March, up from 88 (5%) in February, down from 115 (20%) in May 2024, and down from 142 (35%) in May 2023; Active Listings were at 599 at month end compared to 428 at that time last year (up 40%) and 582 at the end of April (up 3%); the 261 New Listings in May were down 6% compared to April, down 3% compared to March, up 26% compared to February, up 21% compared to May 2024, and up 27% compared to May 2023. Month’s supply of total residential listings is steady at 7 month’s supply (balanced market conditions) and sales to listings ratio of 35% compared to 31% in April, 53% in May 2024, and 69% in May 2023.
Month-over-month, the house price index is down 1.6% and in the last 12 months down 4.5%.
Coquitlam: Total Units Sold in May were 189 – the same as April, down from 233 (19%) in March, up from 165 (15%) in February, down from 228 (17%) in May 2024, and down from 284 (33%) in May 2023; Active Listings were at 1,344 at month end compared to 914 at that time last year (up 1%) and 1,325 at the end of April (up 5%); the 520 New Listings in May were down 17% compared to April, down 12% compared to March, up 10 % compared to February, up 1% compared to May 2024, and up 12% compared to May 2023. Month’s supply of total residential listings is steady at 7 month’s supply (balanced market conditions) and sales to listings ratio of 36% compared to 30% in April, 44% in May 2024, and 61% in May 2023.
Month-over-month, the house price index is down 0.6% and in the last 12 months down 4.6%.
Port Moody: Total Units Sold in May were 61 – up from 51 (20%) in April, up from 51 (20%) in March, up from 40 (53%) in February, up from 58 (5%) in May 2024, and down from 87 (30%) in May 2023; Active Listings were at 372 at month end compared to 219 at that time last year (up 70%) and 343 at the end of April (up %8); the 190 New Listings in May were up 3% compared to April, up 25% compared to March, up 57% compared to February, up 56% compared to May 2024, and up 42% compared to May 2023. Month’s supply of total residential listings is down to 6 month’s supply from 7 (balanced market conditions) and sales to listings ratio of 32% compared to 28% in April, 48% in May 2024, and 65% in May 2023.
Month-over-month, the house price index is up 0.6% and in the last 12 months down 4.4%.
Port Coquitlam: Total Units Sold in May were 55 – down from 70 (21%) in April, down from 62 (11%) in March, up from 58 (5%) in February, down from 95 (42%) in May 2024, and down from 91 (40%) in May 2023; Active Listings were at 384 at month end compared to 278 at that time last year (up 38%) and 353 at the end of April (up 9%); the 186 New Listings in May were down 6% compared to April, up 6% compared to March, up 44% compared to February, up 7% compared to May 2024, and up 27% compared to May 2023. Month’s supply of total residential listings is up to 7 month’s supply from 5 (balanced market conditions) and sales to listings ratio of 30% compared to 36% in April, 55% in May 2024, and 62% in May 2023.
Month-over-month, the house price index is up 0.1% and in the last 12 months down 1.4%.
Pitt Meadows: Total Units Sold in May were 18 – down from 27 (33%) in April, down from 27 (33%) in March, down from 21 (14%) in February, down from 30 (40%) in May 2024, and down from 39 (54%) in May 2023; Active Listings were at 147 at month end compared to 94 at that time last year (up 56%) and 122 at the end of April (up 20%); the 76 New Listings in May were up 23% compared to April, up 15% compared to March, up 73% compared to February, up 5% compared to May 2024, and up 69% compared to May 2023. Month’s supply of total residential listings is up to 8 month’s supply from 5 (buyer’s market conditions) and sales to listings ratio of 23% compared to 43% in April, 41% in May 2024, and 86% in May 2023.
Month-over-month, the house price index is down 0.6% and in the last 12 months down 2.1%.
Maple Ridge: Total Units Sold in May were 134 – up from 127 (6%) in April, up from 108 (24%) in March, up from 129 (4%) in February, down from 172 (22%) in May 2024, and down from 218 (39%) in May 2023; Active Listings were at 1,009 at month end compared to 850 at that time last year (up 18%) and 920 at the end of April (up 10%); the 435 New Listings in May were up 14% compared to April, up 23% compared to March, up 39% compared to February, up 8% compared to May 2024, and up 26% compared to May 2023. Month’s supply of total residential listings is up to 8 month’s supply from 7 (buyer’s market conditions) and sales to listings ratio of 30% compared to 33% in April, 42% in May 2024, and 63% in May 2023.
Month-over-month, the house price index is down 0.5% and in the last 12 months down 1.9%.
Ladner: Total Units Sold in May were 33 – up from 16 (106%) in April, up from 31 (6%) in March, up from 29 (14%) in February, the same as May 2024, and down from 54 (39%) in May 2023; Active Listings were at 192 at month end compared to 139 at that time last year (up 8%) and 178 at the end of April (up 5%); the 81 New Listings in May were up 5% compared to April, up 19% compared to March, up 23% compared to February, up 7% compared to May 2024, and up 62% compared to May 2023. Month’s supply of total residential listings is down to 6 month’s supply from 11 (balanced market conditions) and sales to listings ratio of 41% compared to 21% in April, 43% in May 2024, and 108% in May 2023.
Month-over-month, the house price index is down 0.3% and in the last 12 months down 2.2%.
Tsawwassen: Total Units Sold in May were 42 – up from 40 (5%) in April, up from 36 (17%) in March, up from 28 (50%) in February, up from 40 (5%) in May 2024, and down from 62 (32%) in May 2023; Active Listings were at 331 at month end compared to 218 at that time last year (up 52%) and 306 at the end of April (up 8%); the 136 New Listings in May were up 9% compared to April, up 37% compared to March, up 39% compared to February, up 37% compared to May 2024, and up 49% compared to May 2023. Month’s supply of total residential listings is steady at 8 month’s supply (buyer’s market conditions) and sales to listings ratio of 31% compared to 32% in April, 40% in May 2024, and 68% in May 2023.
Month-over-month, the house price index is down 0.8% and in the last 12 months down 4.9%.
Fraser Valley: Sales in May were up 13.4%, compared to April and were down 22.0% from May 2024. New listings were up 6.5% from April and up 6.6% from May 2024.The average price was down 0.5% month-over-month and is down 8.3% year-over-year. Active listings were up 5.8% to 10,626 from 10,046 last month and up 34.4% from May 2024 which was at 7,904. Month’s supply of total residential listings decreased from 10 to 9 months (buyer’s market conditions).
Month-over-month, the house price index is down 1.0% and in the last 12 months down 4.3%.